Unlock a world of possibilities! Login now and discover the exclusive benefits awaiting you.

- Qlik Community
- :
- All Forums
- :
- QlikView
- :
- Question on Trellis Chart - need title in heading
- Subscribe to RSS Feed
- Mark Topic as New
- Mark Topic as Read
- Float this Topic for Current User
- Bookmark
- Subscribe
- Mute
- Printer Friendly Page

 gerrycastellino
- Mark as New
- Bookmark
- Subscribe
- Mute
- Subscribe to RSS Feed
- Permalink
- Report Inappropriate Content
Question on Trellis Chart - need title in heading
Is there a way to get the % in the right boxes to show up as part of the titles in the Trellis chart .
see qvw attached.
Gerry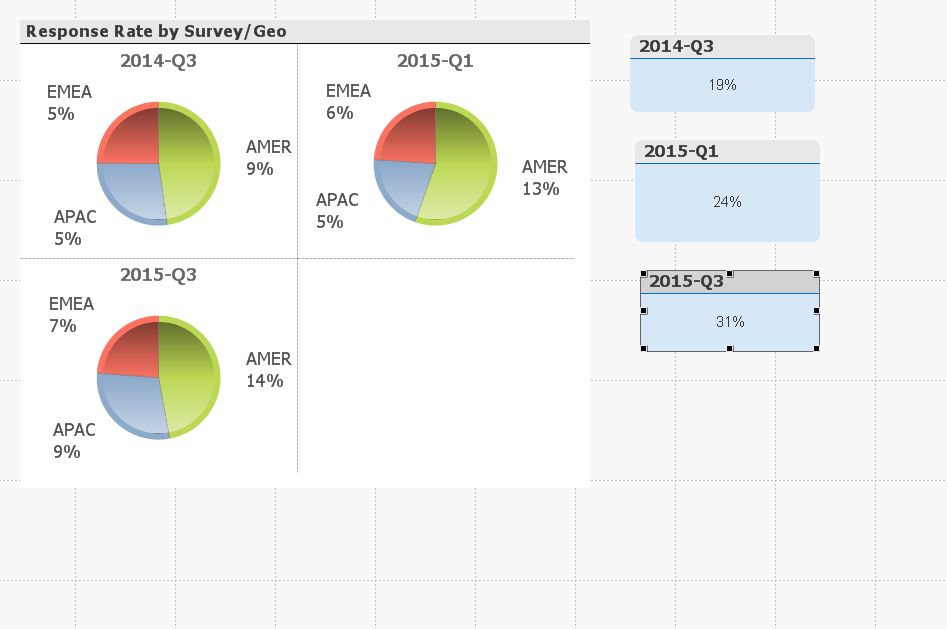
Accepted Solutions

 swuehl
- Mark as New
- Bookmark
- Subscribe
- Mute
- Subscribe to RSS Feed
- Permalink
- Report Inappropriate Content
Maybe using a calculated dimension like
=aggr(Survey_Type & ' ('&num(sum(Record_Counter)/max( Survey_Count),vFormat_Percent)&')', Survey_Type)

 marcus_sommer
- Mark as New
- Bookmark
- Subscribe
- Mute
- Subscribe to RSS Feed
- Permalink
- Report Inappropriate Content
Within the tab presentation you could define "free text" which could like the textbox contain your expressions and if you pressed by activated chart the ctrl+shift key you get red lines within the various chart-parts which you could drag and size with the mouse.
- Marcus
swuehl
- Mark as New
- Bookmark
- Subscribe
- Mute
- Subscribe to RSS Feed
- Permalink
- Report Inappropriate Content
Maybe using a calculated dimension like
=aggr(Survey_Type & ' ('&num(sum(Record_Counter)/max( Survey_Count),vFormat_Percent)&')', Survey_Type)
