Unlock a world of possibilities! Login now and discover the exclusive benefits awaiting you.

- Qlik Community
- :
- All Forums
- :
- QlikView
- :
- Radar Chart with postivie and negative Values
- Subscribe to RSS Feed
- Mark Topic as New
- Mark Topic as Read
- Float this Topic for Current User
- Bookmark
- Subscribe
- Mute
- Printer Friendly Page

 fheidenstecker
- Mark as New
- Bookmark
- Subscribe
- Mute
- Subscribe to RSS Feed
- Permalink
- Report Inappropriate Content
Radar Chart with postivie and negative Values
Hi there,
i want to create a radar chart in Qlikview with positve and negative values (difference in % for some measures).
The chart will not render, due to having positive and negative values in it. The documentation also states that this is not possible. 😞
I cannot think of a reason why it is not possible in Qlik. Obviously it used to work in older versions, and it is even possible in Excel 😉
So nevertheless i wanted to ask if anybody can think of a "workaround" to display both values in the chart?
Thanks for any suggestions
Fabian
 felipedl
- Mark as New
- Bookmark
- Subscribe
- Mute
- Subscribe to RSS Feed
- Permalink
- Report Inappropriate Content
I'd say normalize your data,
Example data I've made here (with negative values)
data:
load * Inline
[
a,b
1,1
2,5
3,3
4,-1
5,-4
];
NoConcatenate
y:
Load
a,
b,
NewValueMax,
Normalized;
Load
a,
b,
NewValueMax,
b+NewValueMin as Normalized
Resident data;

drop table data;

left join (y)
Load
max(Normalized) as MaxNewValue
Resident y;

z:
Load *,
Normalized/MaxNewValue as [Range 0-1]
Resident y;

drop table y;
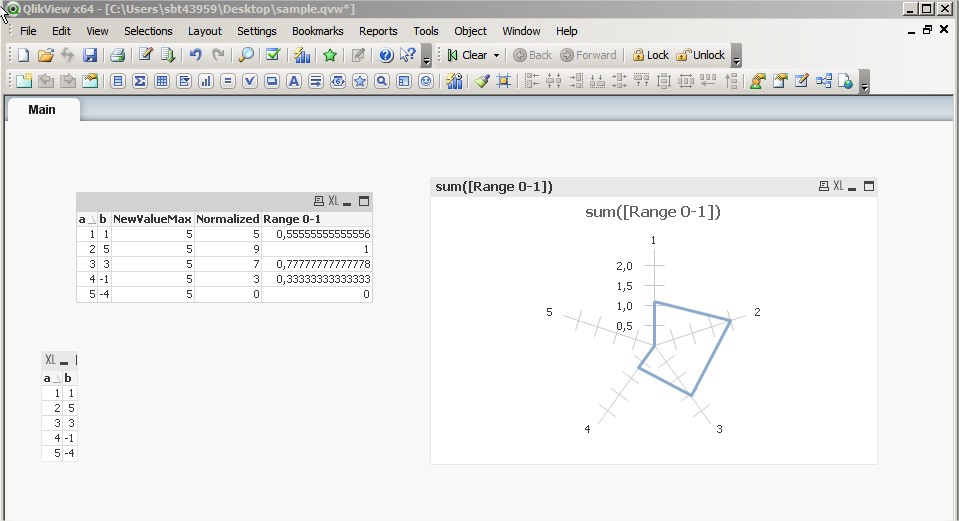
This will get the values for your data into the 0-1 range.
Qlik Radar:
Excel:
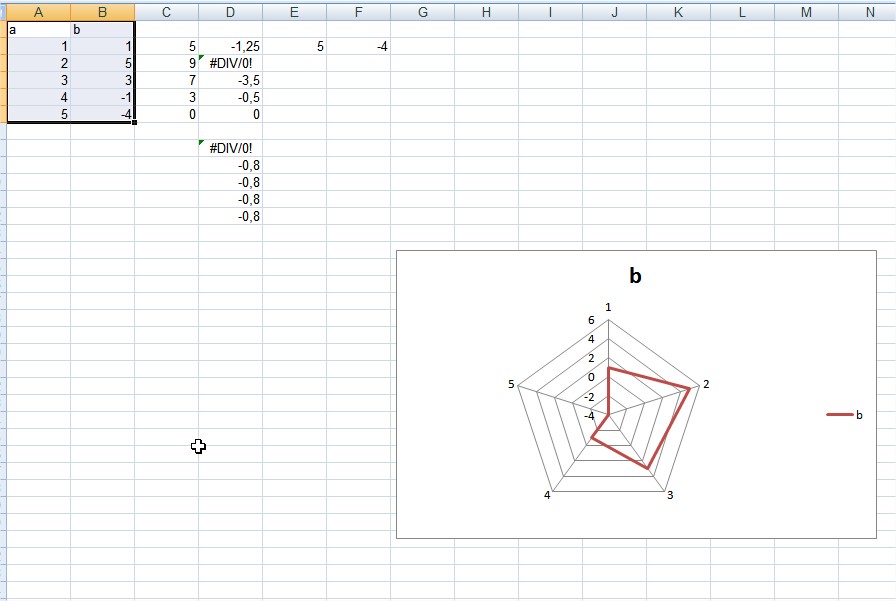
Won't be the same result though, since you tampered with the data a bit.
