Unlock a world of possibilities! Login now and discover the exclusive benefits awaiting you.
- Qlik Community
- :
- All Forums
- :
- QlikView
- :
- Re: Evolutive chart with calculated months
- Subscribe to RSS Feed
- Mark Topic as New
- Mark Topic as Read
- Float this Topic for Current User
- Bookmark
- Subscribe
- Mute
- Printer Friendly Page
- Mark as New
- Bookmark
- Subscribe
- Mute
- Subscribe to RSS Feed
- Permalink
- Report Inappropriate Content
Re: Evolutive chart with calculated months
Hi:
I tried another way:

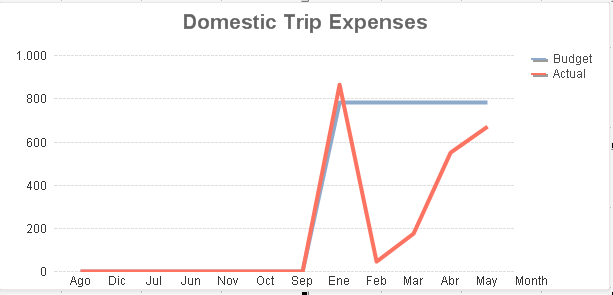
In Properties of my Chart (Dimension) I include all values with option "Show all values"
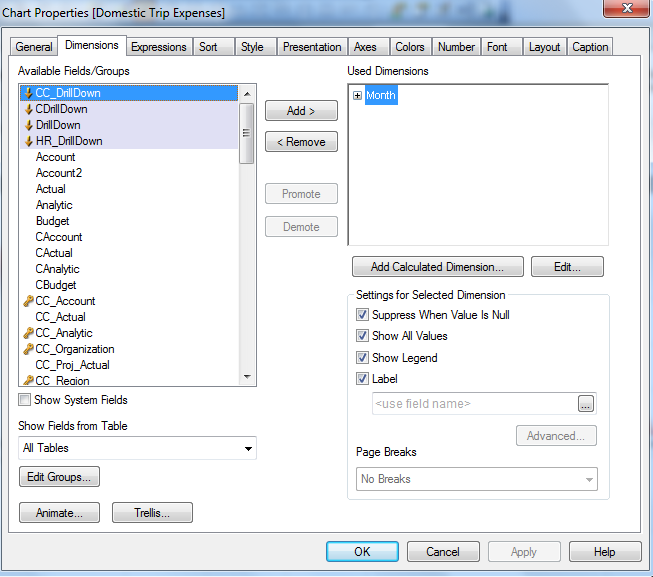
And appear all months, but I loose the budget data between June-Dec.
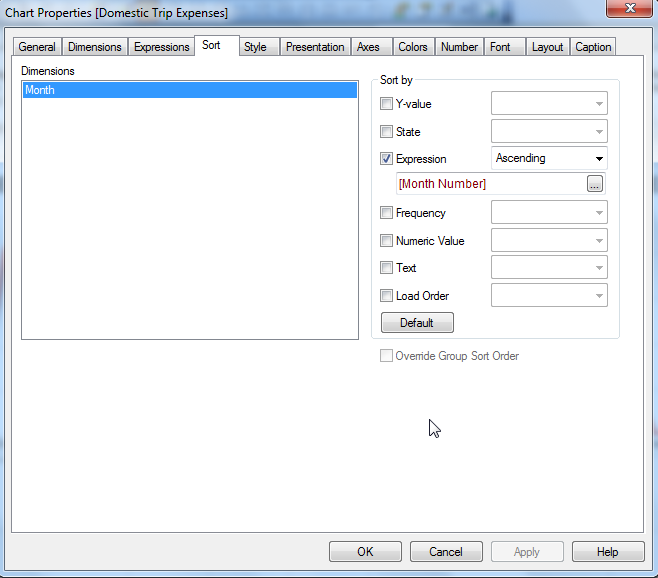
I have also issues with the order of months, despite I have a Month_Number field (01, .., 12) and in SORT option, I do sort the Month dimension by this field (Month_Number) and it is not working....
Can you help mi with that?
Thanks
- Mark as New
- Bookmark
- Subscribe
- Mute
- Subscribe to RSS Feed
- Permalink
- Report Inappropriate Content
Hi,
Order by Numeric Value Ascending.
Best regards.
- Mark as New
- Bookmark
- Subscribe
- Mute
- Subscribe to RSS Feed
- Permalink
- Report Inappropriate Content
Thanks Oswaldo!
Any clue why I loose budget data from Jun-Dic?
- Mark as New
- Bookmark
- Subscribe
- Mute
- Subscribe to RSS Feed
- Permalink
- Report Inappropriate Content
Hi,
There are info for Jun - Dec?
If you can share your qvw
Best Regards.
- Mark as New
- Bookmark
- Subscribe
- Mute
- Subscribe to RSS Feed
- Permalink
- Report Inappropriate Content
I'm sorry!!!
My mistake, I was filtered month from Jan-May 
- Mark as New
- Bookmark
- Subscribe
- Mute
- Subscribe to RSS Feed
- Permalink
- Report Inappropriate Content
jeje sometimes happens.
 regards.