Unlock a world of possibilities! Login now and discover the exclusive benefits awaiting you.
- Qlik Community
- :
- All Forums
- :
- QlikView
- :
- Regarding color
- Subscribe to RSS Feed
- Mark Topic as New
- Mark Topic as Read
- Float this Topic for Current User
- Bookmark
- Subscribe
- Mute
- Printer Friendly Page
- Mark as New
- Bookmark
- Subscribe
- Mute
- Subscribe to RSS Feed
- Permalink
- Report Inappropriate Content
Regarding color
Dear All,
How i can deal with color ..
I want count to be in Red Color for which who is exceeding the limit...and the Limit is 1 ..thoes agent who passes the limit 1 should be appear in Red Color. How i can achieve the same in qlikview.
Please look the below example for my query.
Agent Name Tea-Break Lunch
A 1 1
B 1 2
C 2 1
D 3 1
E 2 2
I do not know much about the color scheme....Please help.
Sarfaraz
- Tags:
- new_to_qlikview
- Mark as New
- Bookmark
- Subscribe
- Mute
- Subscribe to RSS Feed
- Permalink
- Report Inappropriate Content
Can you elaborate more please for which field there is limit.
Regards
Anand
- Mark as New
- Bookmark
- Subscribe
- Mute
- Subscribe to RSS Feed
- Permalink
- Report Inappropriate Content
Create a straight table with Agent Name as dimension and two expression count([Tea-Break]) and count(Lunch). On the dimension tab click on the + sign in front of the dimension and select Background color. Click the Edit button to enter an expression to calculate the background color. Use as expression =if(count([Tea-Break])>1 or count(Lunch)>1 ,lightred()). Next click on the + in front of the expressions on the Expressions tab, select Background color and enter the same color expression in the Definition box.
Or go to the Visual Cues tab and enter the conditions and colors there.
talk is cheap, supply exceeds demand
- Mark as New
- Bookmark
- Subscribe
- Mute
- Subscribe to RSS Feed
- Permalink
- Report Inappropriate Content
Hi Try like
For chart u should have to write the expression which is suggest by @Gysbert
for Straight table > properties > Visual Case tab
select the expression under
Upper > 1 = select color red
- Mark as New
- Bookmark
- Subscribe
- Mute
- Subscribe to RSS Feed
- Permalink
- Report Inappropriate Content
Hi,
Try this way as i understand
Dim:- Agent Name
Expre:-sum([Tea-Break])
Expre:-sum(Lunch)
And in the dimension click on the plus sign and in the background write expression
=if(sum([Tea-Break])>1 or sum(Lunch)>1 ,lightred())
Little bit add in the Gysbert suggestion.
Regards
Anand
- Mark as New
- Bookmark
- Subscribe
- Mute
- Subscribe to RSS Feed
- Permalink
- Report Inappropriate Content
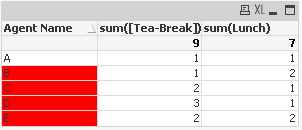
Hi,
Like this ????
Thanks,
AS
- Mark as New
- Bookmark
- Subscribe
- Mute
- Subscribe to RSS Feed
- Permalink
- Report Inappropriate Content
Hi Gysbert,
Thanks a lot for your reply!!!.....Your solution is working fine as expected .....It was new concept for me.
However it is showing TOTAL also in Red color ...As i do not want total to be appear in Red color..What Shoould i do for the same .
Regards
Sarfaraz
- Mark as New
- Bookmark
- Subscribe
- Mute
- Subscribe to RSS Feed
- Permalink
- Report Inappropriate Content
The total rows have a dimensionality value of 0. You can add a check for this condition using the dimensionality() function:
=if(Dimensionality()<>0 and (sum([Tea-Break])>1 or sum(Lunch)>1) ,lightred())
talk is cheap, supply exceeds demand
- Mark as New
- Bookmark
- Subscribe
- Mute
- Subscribe to RSS Feed
- Permalink
- Report Inappropriate Content
Hi Gysbert,
its works fine as expected........however one question again ...Can you please elaborate more about Dimentionality() as i do not have much clarity about this function...Exactly what it is ???
Sarfaraz
- Mark as New
- Bookmark
- Subscribe
- Mute
- Subscribe to RSS Feed
- Permalink
- Report Inappropriate Content
Is your Qlikview installation broken? Normally a help file is installed that can be opened from the Help menu in Qlikview or by pressing the F1 key.
talk is cheap, supply exceeds demand