Unlock a world of possibilities! Login now and discover the exclusive benefits awaiting you.

- Qlik Community
- :
- All Forums
- :
- QlikView
- :
- Relative percentages within chart dimension
- Subscribe to RSS Feed
- Mark Topic as New
- Mark Topic as Read
- Float this Topic for Current User
- Bookmark
- Subscribe
- Mute
- Printer Friendly Page

- Mark as New
- Bookmark
- Subscribe
- Mute
- Subscribe to RSS Feed
- Permalink
- Report Inappropriate Content
Relative percentages within chart dimension
This is probably really simple but i can't seem to find the solution.
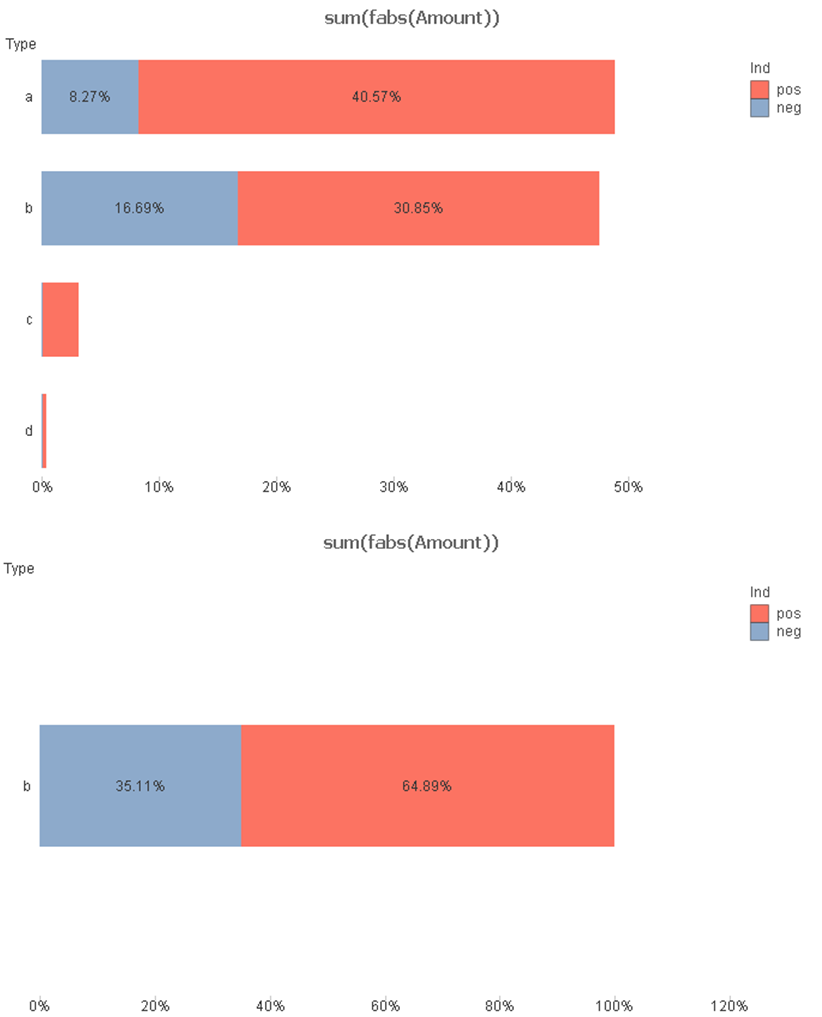
Below on chart 1 I would like each Type to be on a scale of a 100%. If i drill down, chart 2, I get what I would like at the higher level. I have selected "relative", and the formula is a sum of an amount that can be positive or negative. Each negative will have a corresponding positive, so i would like the % of negatives & positives.
- Tags:
- new_to_qlikview

 goldnejea8
- Mark as New
- Bookmark
- Subscribe
- Mute
- Subscribe to RSS Feed
- Permalink
- Report Inappropriate Content
The relative option shows the percent as compared across your entire dimension (type) set.
Try doing something like this:
sum(fabs(Amount))/aggr(nodistinct sum(fabs(amount)),type)
De-Select the relative option, and on the numbers tab, choose Number and select Show in Percent (%)
qlikuser14 answered this question in this post: