Unlock a world of possibilities! Login now and discover the exclusive benefits awaiting you.

- Qlik Community
- :
- All Forums
- :
- QlikView
- :
- Requirement on table box
- Subscribe to RSS Feed
- Mark Topic as New
- Mark Topic as Read
- Float this Topic for Current User
- Bookmark
- Subscribe
- Mute
- Printer Friendly Page

- Mark as New
- Bookmark
- Subscribe
- Mute
- Subscribe to RSS Feed
- Permalink
- Report Inappropriate Content
Requirement on table box
Hi
i have table box in that i have 5 fields
for example:
City population Growth P% Status
London, 22000 2% 1% Green
New York 12500 1% 0.5% yellow
Spain 52000 29% 5% Green
Delhi 1300 0% 2% Red
Hyd 15000 5% 1% green
i have to display only last 3 records how to do this .i am using table box here
Thanks
- « Previous Replies
-
- 1
- 2
- Next Replies »
Accepted Solutions

 swuehl
- Mark as New
- Bookmark
- Subscribe
- Mute
- Subscribe to RSS Feed
- Permalink
- Report Inappropriate Content
Create a straight table chart with all your 5 fields as dimension and a single expression
=Only({<City = {Spain,Delhi,Hyd}>} City) // adapt the list of cities as needed
On presentation tab of chart properties, hide the expression column.
Is this what you want?

 sunny_talwar
- Mark as New
- Bookmark
- Subscribe
- Mute
- Subscribe to RSS Feed
- Permalink
- Report Inappropriate Content
Is there a reason you want to do this in table box? Straight table won't work? and why the last 3 records? What is so unique about them?
swuehl
- Mark as New
- Bookmark
- Subscribe
- Mute
- Subscribe to RSS Feed
- Permalink
- Report Inappropriate Content
Select Spain, Delhi and Hyd
You can't use expressions or filters in the table box object, so maybe use a straight table chart if you need a filter within the object.
sunny_talwar
- Mark as New
- Bookmark
- Subscribe
- Mute
- Subscribe to RSS Feed
- Permalink
- Report Inappropriate Content
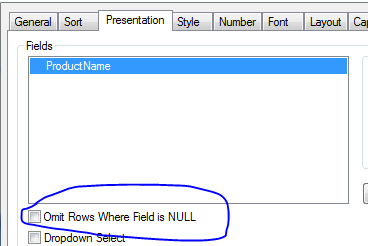
I was thinking of flagging the last three rows with 1 and rest of the 2 as null and then on the properties tab going to select 'Omit Rows Where Field is Null' for the flag dimension. But I really don't know what the goal is
swuehl
- Mark as New
- Bookmark
- Subscribe
- Mute
- Subscribe to RSS Feed
- Permalink
- Report Inappropriate Content
Might be a good idea anyway..
- Mark as New
- Bookmark
- Subscribe
- Mute
- Subscribe to RSS Feed
- Permalink
- Report Inappropriate Content
please give expression for Straight table
sunny_talwar
- Mark as New
- Bookmark
- Subscribe
- Mute
- Subscribe to RSS Feed
- Permalink
- Report Inappropriate Content
What is the logic? Unless we know why you want to show the last 3 it would be difficult to offer a solution 
- Mark as New
- Bookmark
- Subscribe
- Mute
- Subscribe to RSS Feed
- Permalink
- Report Inappropriate Content
i have 55 records in Field City but i have to show the records only 5 among that 55 in any table or straight table
- Mark as New
- Bookmark
- Subscribe
- Mute
- Subscribe to RSS Feed
- Permalink
- Report Inappropriate Content
i have to show the data only few particular Cities(Only 5records)
swuehl
- Mark as New
- Bookmark
- Subscribe
- Mute
- Subscribe to RSS Feed
- Permalink
- Report Inappropriate Content
Create a straight table chart with all your 5 fields as dimension and a single expression
=Only({<City = {Spain,Delhi,Hyd}>} City) // adapt the list of cities as needed
On presentation tab of chart properties, hide the expression column.
Is this what you want?
- « Previous Replies
-
- 1
- 2
- Next Replies »