Unlock a world of possibilities! Login now and discover the exclusive benefits awaiting you.
- Qlik Community
- :
- All Forums
- :
- QlikView
- :
- Roll up data week wise
- Subscribe to RSS Feed
- Mark Topic as New
- Mark Topic as Read
- Float this Topic for Current User
- Bookmark
- Subscribe
- Mute
- Printer Friendly Page
- Mark as New
- Bookmark
- Subscribe
- Mute
- Subscribe to RSS Feed
- Permalink
- Report Inappropriate Content
Roll up data week wise
Hello experts,
I have year data and my requirement is it should roll up data week wise.
For example.
week measure
7/30/2015 20
7/23/2015 50
7/16/2015 40
7/09/2015 100
.
.
..
The data here splitting week wise and rolling up, what are the data available in that weeks.
Please help me on that issue.
Regards,
Kumar
- Tags:
- qlikview_scripting
Accepted Solutions
- Mark as New
- Bookmark
- Subscribe
- Mute
- Subscribe to RSS Feed
- Permalink
- Report Inappropriate Content
- Mark as New
- Bookmark
- Subscribe
- Mute
- Subscribe to RSS Feed
- Permalink
- Report Inappropriate Content
What is your desired results?
- Mark as New
- Bookmark
- Subscribe
- Mute
- Subscribe to RSS Feed
- Permalink
- Report Inappropriate Content
Hi,
Pls find the screen shot of requirement.
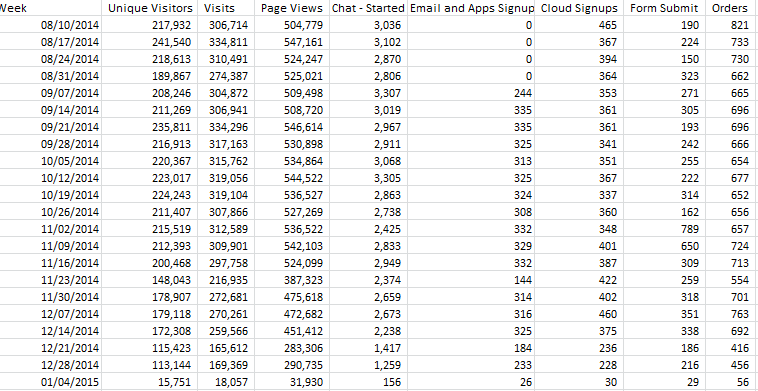
In this screen shot for every week it is rolling up .
measures for each respectively
1) =count(DISTINCT{$<[Site Visit Hit Source]={"<>5,7,8,9"}, [Site Visit Post Page Event] = {0}>} [Visitor ID])
2) =count(DISTINCT{$<[Site Visit Hit Source]={"<>5,7,8,9"}, [Site Visit Post Page Event] = {0}>} [Visitor ID]&'_'&[Site Visit Vis Num])
3) =sum({$<[Site Visit Hit Source]={"<>5,8,9"}, [Site Visit Post Page Event] = {0}>} [Site Visit Record Count])
like that I can calculate.
But in the dates I want to roll up for each week.
- Mark as New
- Bookmark
- Subscribe
- Mute
- Subscribe to RSS Feed
- Permalink
- Report Inappropriate Content
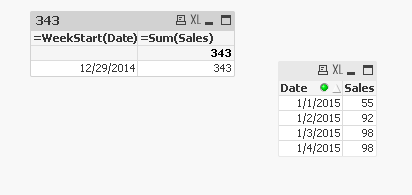
Try this may be:
Calculated Dimension: WeekStart(Date)
Expression: Sum(Measure)
- Mark as New
- Bookmark
- Subscribe
- Mute
- Subscribe to RSS Feed
- Permalink
- Report Inappropriate Content
Thanks for ur reply. It is splitting by week wise, but roll up is not happening.
Regards,
Kumar
- Mark as New
- Bookmark
- Subscribe
- Mute
- Subscribe to RSS Feed
- Permalink
- Report Inappropriate Content
Is this not what you wanted?
- Mark as New
- Bookmark
- Subscribe
- Mute
- Subscribe to RSS Feed
- Permalink
- Report Inappropriate Content
My apologize and it is working. Thanks a lot.
- Mark as New
- Bookmark
- Subscribe
- Mute
- Subscribe to RSS Feed
- Permalink
- Report Inappropriate Content
No worries... 
I am glad it worked.
Best,
Sunny