Unlock a world of possibilities! Login now and discover the exclusive benefits awaiting you.

- Qlik Community
- :
- All Forums
- :
- QlikView
- :
- Re: Set Analasys
- Subscribe to RSS Feed
- Mark Topic as New
- Mark Topic as Read
- Float this Topic for Current User
- Bookmark
- Subscribe
- Mute
- Printer Friendly Page

 michael84
- Mark as New
- Bookmark
- Subscribe
- Mute
- Subscribe to RSS Feed
- Permalink
- Report Inappropriate Content
Set Analasys
Hello
I got the following bar chart with the following formula:
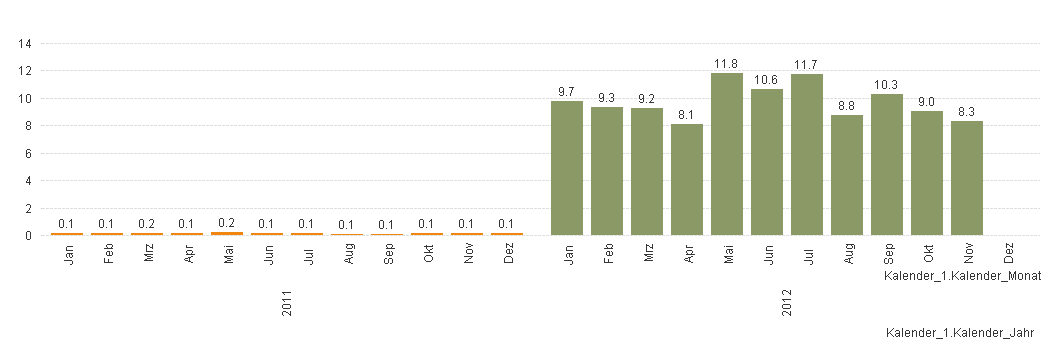
My current selection is Year = 2012.
Avg
( {$<Year= {$(=only(Year))}, Diff_Terminvergabe_Untersuch={">0"}, Patientenart= {'ambulant'},
Diff_Terminvergabe_Untersuch={
"=(Avg(Diff_Terminvergabe_Untersuch)+(Stdev(Diff_Terminvergabe_Untersuch)*3))>=Diff_Terminvergabe_Untersuch"
} >} Diff_Terminvergabe_Untersuch)
The socond formula ist the same as the one above, only the expressen Year= {$(=only(Year)-1)
is supposed to show the 2011 values, but it won't as i want... In fact 2011 should look like 2012. When removing "Year= {$(=only(Year))", then it's working as long as the current selection ist 2012 and 2011. But thats not how i want it...
Thanks for your Help
Michael
- Tags:
- new_to_qlikview
- « Previous Replies
-
- 1
- 2
- Next Replies »
michael84
- Mark as New
- Bookmark
- Subscribe
- Mute
- Subscribe to RSS Feed
- Permalink
- Report Inappropriate Content
Unbelievable you made it… Thanks a lot for your help!!!

- « Previous Replies
-
- 1
- 2
- Next Replies »