Unlock a world of possibilities! Login now and discover the exclusive benefits awaiting you.

- Qlik Community
- :
- All Forums
- :
- QlikView
- :
- Set Analysis, 1 Dimension & 2 Facts Tables
- Subscribe to RSS Feed
- Mark Topic as New
- Mark Topic as Read
- Float this Topic for Current User
- Bookmark
- Subscribe
- Mute
- Printer Friendly Page

- Mark as New
- Bookmark
- Subscribe
- Mute
- Subscribe to RSS Feed
- Permalink
- Report Inappropriate Content
Set Analysis, 1 Dimension & 2 Facts Tables
Dear Expert,
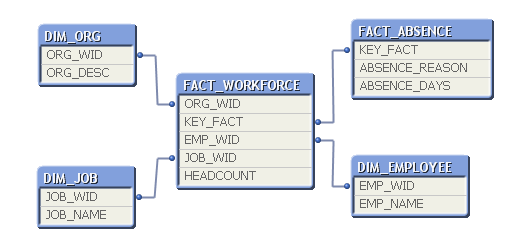
I have a data model like this :
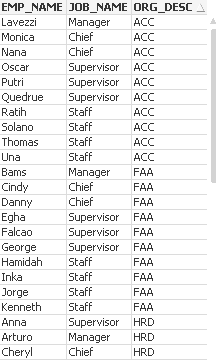
From that, I can make a data of Employee Detail and Employee Absence Days :
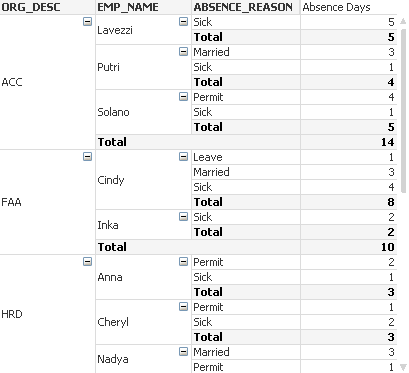
My question is, what is the best script expression to make an analysis of Total All Employee versus Total Employee who make an absence ?
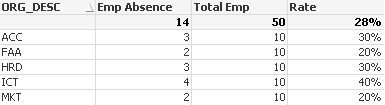
For example, ORG_DESC = 'ACC' have 10 total employees, and have 3 employees who make an absence. So the expression is 3/10 = 30%.
Anyone can help me? Thank you.
Denny Setiawan
Accepted Solutions

 sunny_talwar
- Mark as New
- Bookmark
- Subscribe
- Mute
- Subscribe to RSS Feed
- Permalink
- Report Inappropriate Content
Are you looking to do this in the above Pivot table or are you going to create a new table for this??? If you are planning to create a new table then may be add ORG_DESC as your dimension and this as expression
Count(DISTINCT {<ABSENSE_REASON = {"?*"}>}EMP_NAME)/Count(DISTINCT EMP_NAME)
sunny_talwar
- Mark as New
- Bookmark
- Subscribe
- Mute
- Subscribe to RSS Feed
- Permalink
- Report Inappropriate Content
Are you looking to do this in the above Pivot table or are you going to create a new table for this??? If you are planning to create a new table then may be add ORG_DESC as your dimension and this as expression
Count(DISTINCT {<ABSENSE_REASON = {"?*"}>}EMP_NAME)/Count(DISTINCT EMP_NAME)
- Mark as New
- Bookmark
- Subscribe
- Mute
- Subscribe to RSS Feed
- Permalink
- Report Inappropriate Content
Thank you Sunny.
Finally I can make this analysis
Regards,
Denny Setiawan
sunny_talwar
- Mark as New
- Bookmark
- Subscribe
- Mute
- Subscribe to RSS Feed
- Permalink
- Report Inappropriate Content
Great 
I am glad you are able to figure it out.
Best,
Sunny