Unlock a world of possibilities! Login now and discover the exclusive benefits awaiting you.
Announcements
ALERT: QlikView server communication interruptions following Microsoft Windows Domain Controller security updates
- Qlik Community
- :
- All Forums
- :
- QlikView
- :
- Show Stacked Bars
Options
- Subscribe to RSS Feed
- Mark Topic as New
- Mark Topic as Read
- Float this Topic for Current User
- Bookmark
- Subscribe
- Mute
- Printer Friendly Page
Turn on suggestions
Auto-suggest helps you quickly narrow down your search results by suggesting possible matches as you type.
Showing results for
Contributor III
2018-06-11
10:01 AM
- Mark as New
- Bookmark
- Subscribe
- Mute
- Subscribe to RSS Feed
- Permalink
- Report Inappropriate Content
Show Stacked Bars
Hi,
I have a pivot table with one dimension and two expressions. The two expressions are represented as text and I also have to represent those two expressions in a bar chart.
Display Options>Representation>Linear Gauge
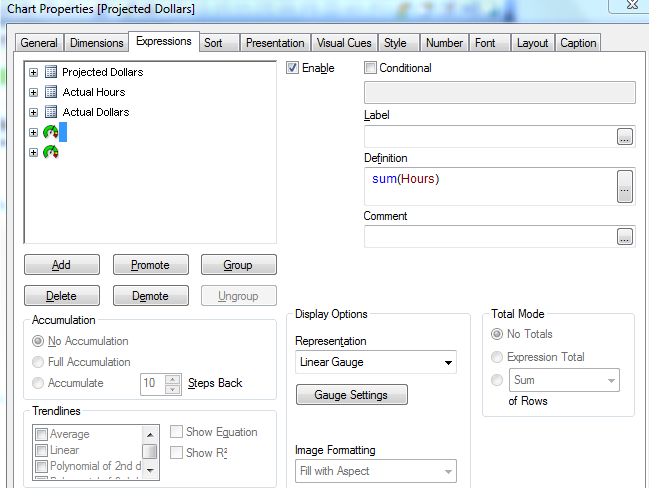
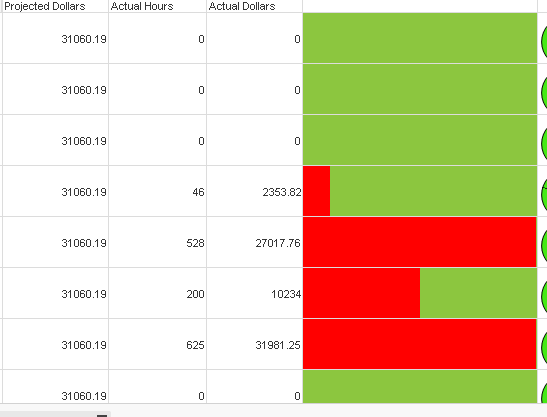
I want to show both the expression in a stacked bar form. What I have done here is made the entire bar green and have made the 2nd expression red so it looks like there are two stacked bars.
I'm not able to add a 2nd expression for the Linear gauge chart.
Can anyone help?
Thanks,
YASH
- Tags:
- bar stacked
- chart bar
687 Views
1 Reply
Specialist
2018-06-11
11:49 AM
- Mark as New
- Bookmark
- Subscribe
- Mute
- Subscribe to RSS Feed
- Permalink
- Report Inappropriate Content
Style tab - Stacked bar is not working? Can you share your sample application.
637 Views