Unlock a world of possibilities! Login now and discover the exclusive benefits awaiting you.

- Qlik Community
- :
- All Forums
- :
- QlikView
- :
- Show all value on time chart
- Subscribe to RSS Feed
- Mark Topic as New
- Mark Topic as Read
- Float this Topic for Current User
- Bookmark
- Subscribe
- Mute
- Printer Friendly Page

- Mark as New
- Bookmark
- Subscribe
- Mute
- Subscribe to RSS Feed
- Permalink
- Report Inappropriate Content
Show all value on time chart
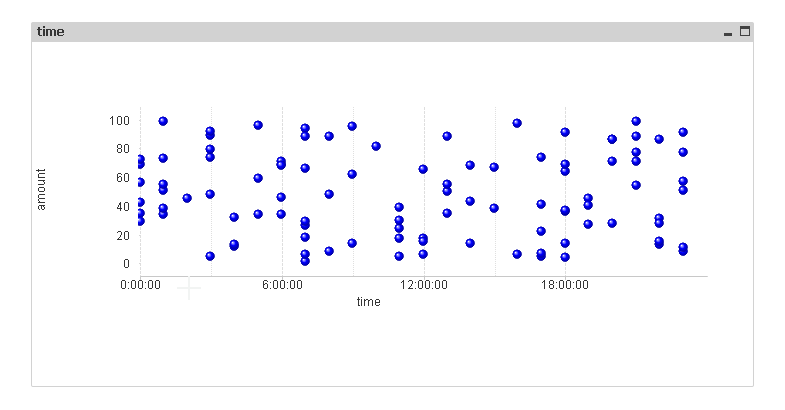
I feel short of one function to built one chart, but maybe im wrong and with your help i can built it.
I have time axis (X) and many records (example sales data)- many values for one day.
I want chart that show literally all values- not only min/max/avg calculated from those records but kind of scatter plot showing whole range of data.
Example

thanks in advace
Accepted Solutions

 maxgro
- Mark as New
- Bookmark
- Subscribe
- Mute
- Subscribe to RSS Feed
- Permalink
- Report Inappropriate Content
maxgro
- Mark as New
- Bookmark
- Subscribe
- Mute
- Subscribe to RSS Feed
- Permalink
- Report Inappropriate Content
like this?
PFA
- Mark as New
- Bookmark
- Subscribe
- Mute
- Subscribe to RSS Feed
- Permalink
- Report Inappropriate Content
Exactly like this!
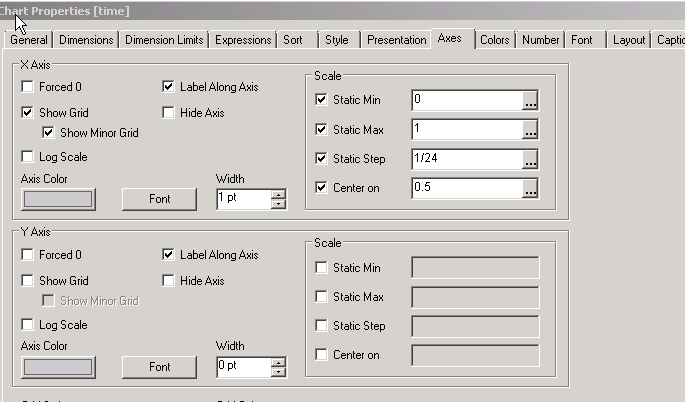
Unfortunetely I have license for one author and I cannot (yet) open qvw files made by someone else. Could you put here screens of expression and dimension of this chart, please? I would really appreciate.
maxgro
- Mark as New
- Bookmark
- Subscribe
- Mute
- Subscribe to RSS Feed
- Permalink
- Report Inappropriate Content
a:
load
ROWNO() AS id,
time(frac(makedate(2015) + floor(rand()*210*1) + floor(rand()*24, 1/24))) as time,
floor(rand()*100) as amount
AutoGenerate 100;
chart is a scatter with
dimension id
expression time (backgroun color ...), formatted as time in number tab hh:mm
amount
- Mark as New
- Bookmark
- Subscribe
- Mute
- Subscribe to RSS Feed
- Permalink
- Report Inappropriate Content
Ok. Thanks. But what if my date dimension is text label, not a numer? And "Expression default" as Number format expression doesn't help at all.
When I use my time dimension as dimension there is no problem, but here I need to use it as expression.