Unlock a world of possibilities! Login now and discover the exclusive benefits awaiting you.

- Qlik Community
- :
- All Forums
- :
- QlikView
- :
- Show difference in line chart
Options
- Subscribe to RSS Feed
- Mark Topic as New
- Mark Topic as Read
- Float this Topic for Current User
- Bookmark
- Subscribe
- Mute
- Printer Friendly Page
Turn on suggestions
Auto-suggest helps you quickly narrow down your search results by suggesting possible matches as you type.
Showing results for

 anuradhaa
Partner - Creator II
2016-04-04
07:01 AM
- Mark as New
- Bookmark
- Subscribe
- Mute
- Subscribe to RSS Feed
- Permalink
- Report Inappropriate Content
Show difference in line chart
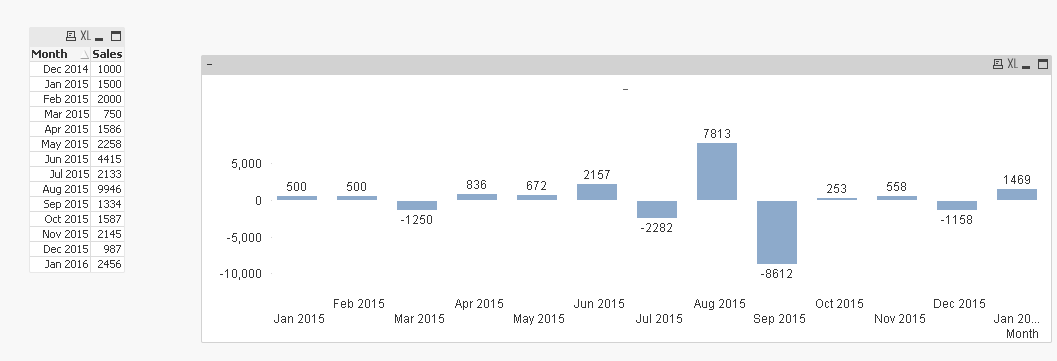
I have below data set. I want to calculate the differance and show that in line chart
My Data set as follow
| Month | Sales |
| 2014-dec | 1000 |
| 2015-jan | 1500 |
| 2015-feb | 2000 |
| 2015-march | 750 |
| 2015-april | 1586 |
| 2015-may | 2258 |
| 2015-june | 4415 |
| 2015-july | 2133 |
| 2015-aug | 9946 |
| 2015-sep | 1334 |
| 2015-oct | 1587 |
| 2015-now | 2145 |
| 2015-dec | 987 |
| 2016-jan | 2456 |
I want to show
| jan-dec | 500 |
| Jan - feb | 500 |
| feb -march | -1250 |
| march - apr | 836 |
| apr -may | 672 |
| may -june | 2157 |
etc in line chart. for last 12 months
is it possible
1,284 Views
1 Solution
Accepted Solutions

 swuehl
Champion III
2016-04-04
07:05 AM
- Mark as New
- Bookmark
- Subscribe
- Mute
- Subscribe to RSS Feed
- Permalink
- Report Inappropriate Content
Maybe like
=Sum(Sales) -Above(Sum(Sales))
as expression with dimension Month
2 Replies
swuehl
Champion III
2016-04-04
07:05 AM
- Mark as New
- Bookmark
- Subscribe
- Mute
- Subscribe to RSS Feed
- Permalink
- Report Inappropriate Content
Maybe like
=Sum(Sales) -Above(Sum(Sales))
as expression with dimension Month

 sunny_talwar
MVP
2016-04-04
07:07 AM
- Mark as New
- Bookmark
- Subscribe
- Mute
- Subscribe to RSS Feed
- Permalink
- Report Inappropriate Content
May be like the attached