Unlock a world of possibilities! Login now and discover the exclusive benefits awaiting you.

- Qlik Community
- :
- All Forums
- :
- QlikView
- :
- Show excluded values in a table
- Subscribe to RSS Feed
- Mark Topic as New
- Mark Topic as Read
- Float this Topic for Current User
- Bookmark
- Subscribe
- Mute
- Printer Friendly Page

 kinjal1645
- Mark as New
- Bookmark
- Subscribe
- Mute
- Subscribe to RSS Feed
- Permalink
- Report Inappropriate Content
Show excluded values in a table
Hello,
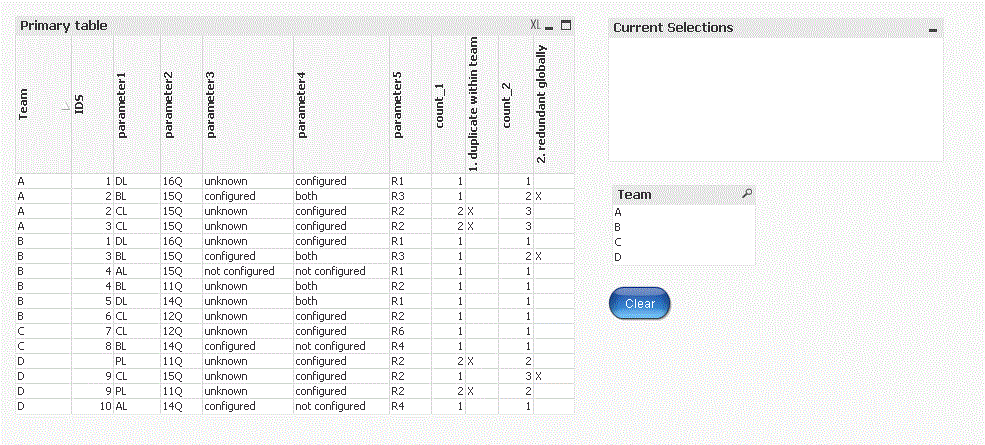
I have following table:
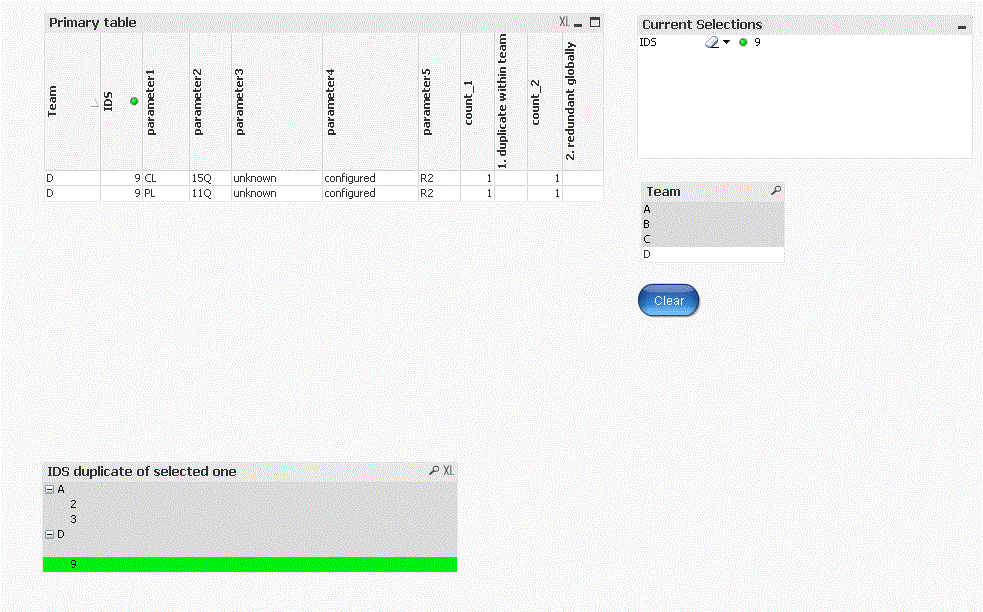
Requirement: When any IDS from primary table is selected, all IDS with same parameter combination should be displayed in separate table. (In below screenshot, IDS 9 is selected in primary table so in list box with IDS 2, 3 and 9 which have same parameter combination are displayed)
It is implemented through list box but I want it in a table with columns Team and IDS.
Since IDS will be excluded as seen in list box, I don't how to do show show excluded values in a table with above requirement.
Can you guys help me?
Thanks
Kinjal
Accepted Solutions

 sunny_talwar
- Mark as New
- Bookmark
- Subscribe
- Mute
- Subscribe to RSS Feed
- Permalink
- Report Inappropriate Content
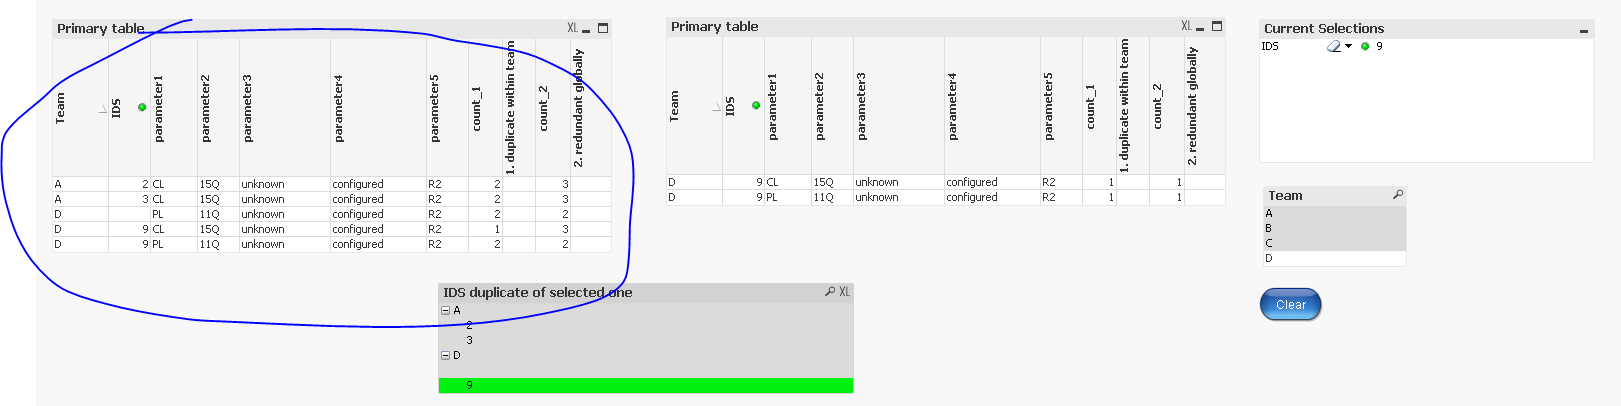
May be use the same set analysis in your chart expressions
{1<
parameter1=p(parameter1),
parameter2=p(parameter2),
parameter3=p(parameter3),
parameter4=p(parameter4),
parameter5=p(parameter5)
>}
sunny_talwar
- Mark as New
- Bookmark
- Subscribe
- Mute
- Subscribe to RSS Feed
- Permalink
- Report Inappropriate Content
May be use the same set analysis in your chart expressions
{1<
parameter1=p(parameter1),
parameter2=p(parameter2),
parameter3=p(parameter3),
parameter4=p(parameter4),
parameter5=p(parameter5)
>}
kinjal1645
- Mark as New
- Bookmark
- Subscribe
- Mute
- Subscribe to RSS Feed
- Permalink
- Report Inappropriate Content
Perfect!
Thank you 

 pintucs20
- Mark as New
- Bookmark
- Subscribe
- Mute
- Subscribe to RSS Feed
- Permalink
- Report Inappropriate Content
Hi Kinjal,
Use all parameter in SET Analysis .
