Unlock a world of possibilities! Login now and discover the exclusive benefits awaiting you.

- Qlik Community
- :
- All Forums
- :
- QlikView
- :
- Show value in legend - Line Chart
- Subscribe to RSS Feed
- Mark Topic as New
- Mark Topic as Read
- Float this Topic for Current User
- Bookmark
- Subscribe
- Mute
- Printer Friendly Page

 jose_vargas
- Mark as New
- Bookmark
- Subscribe
- Mute
- Subscribe to RSS Feed
- Permalink
- Report Inappropriate Content
Show value in legend - Line Chart
Hello-
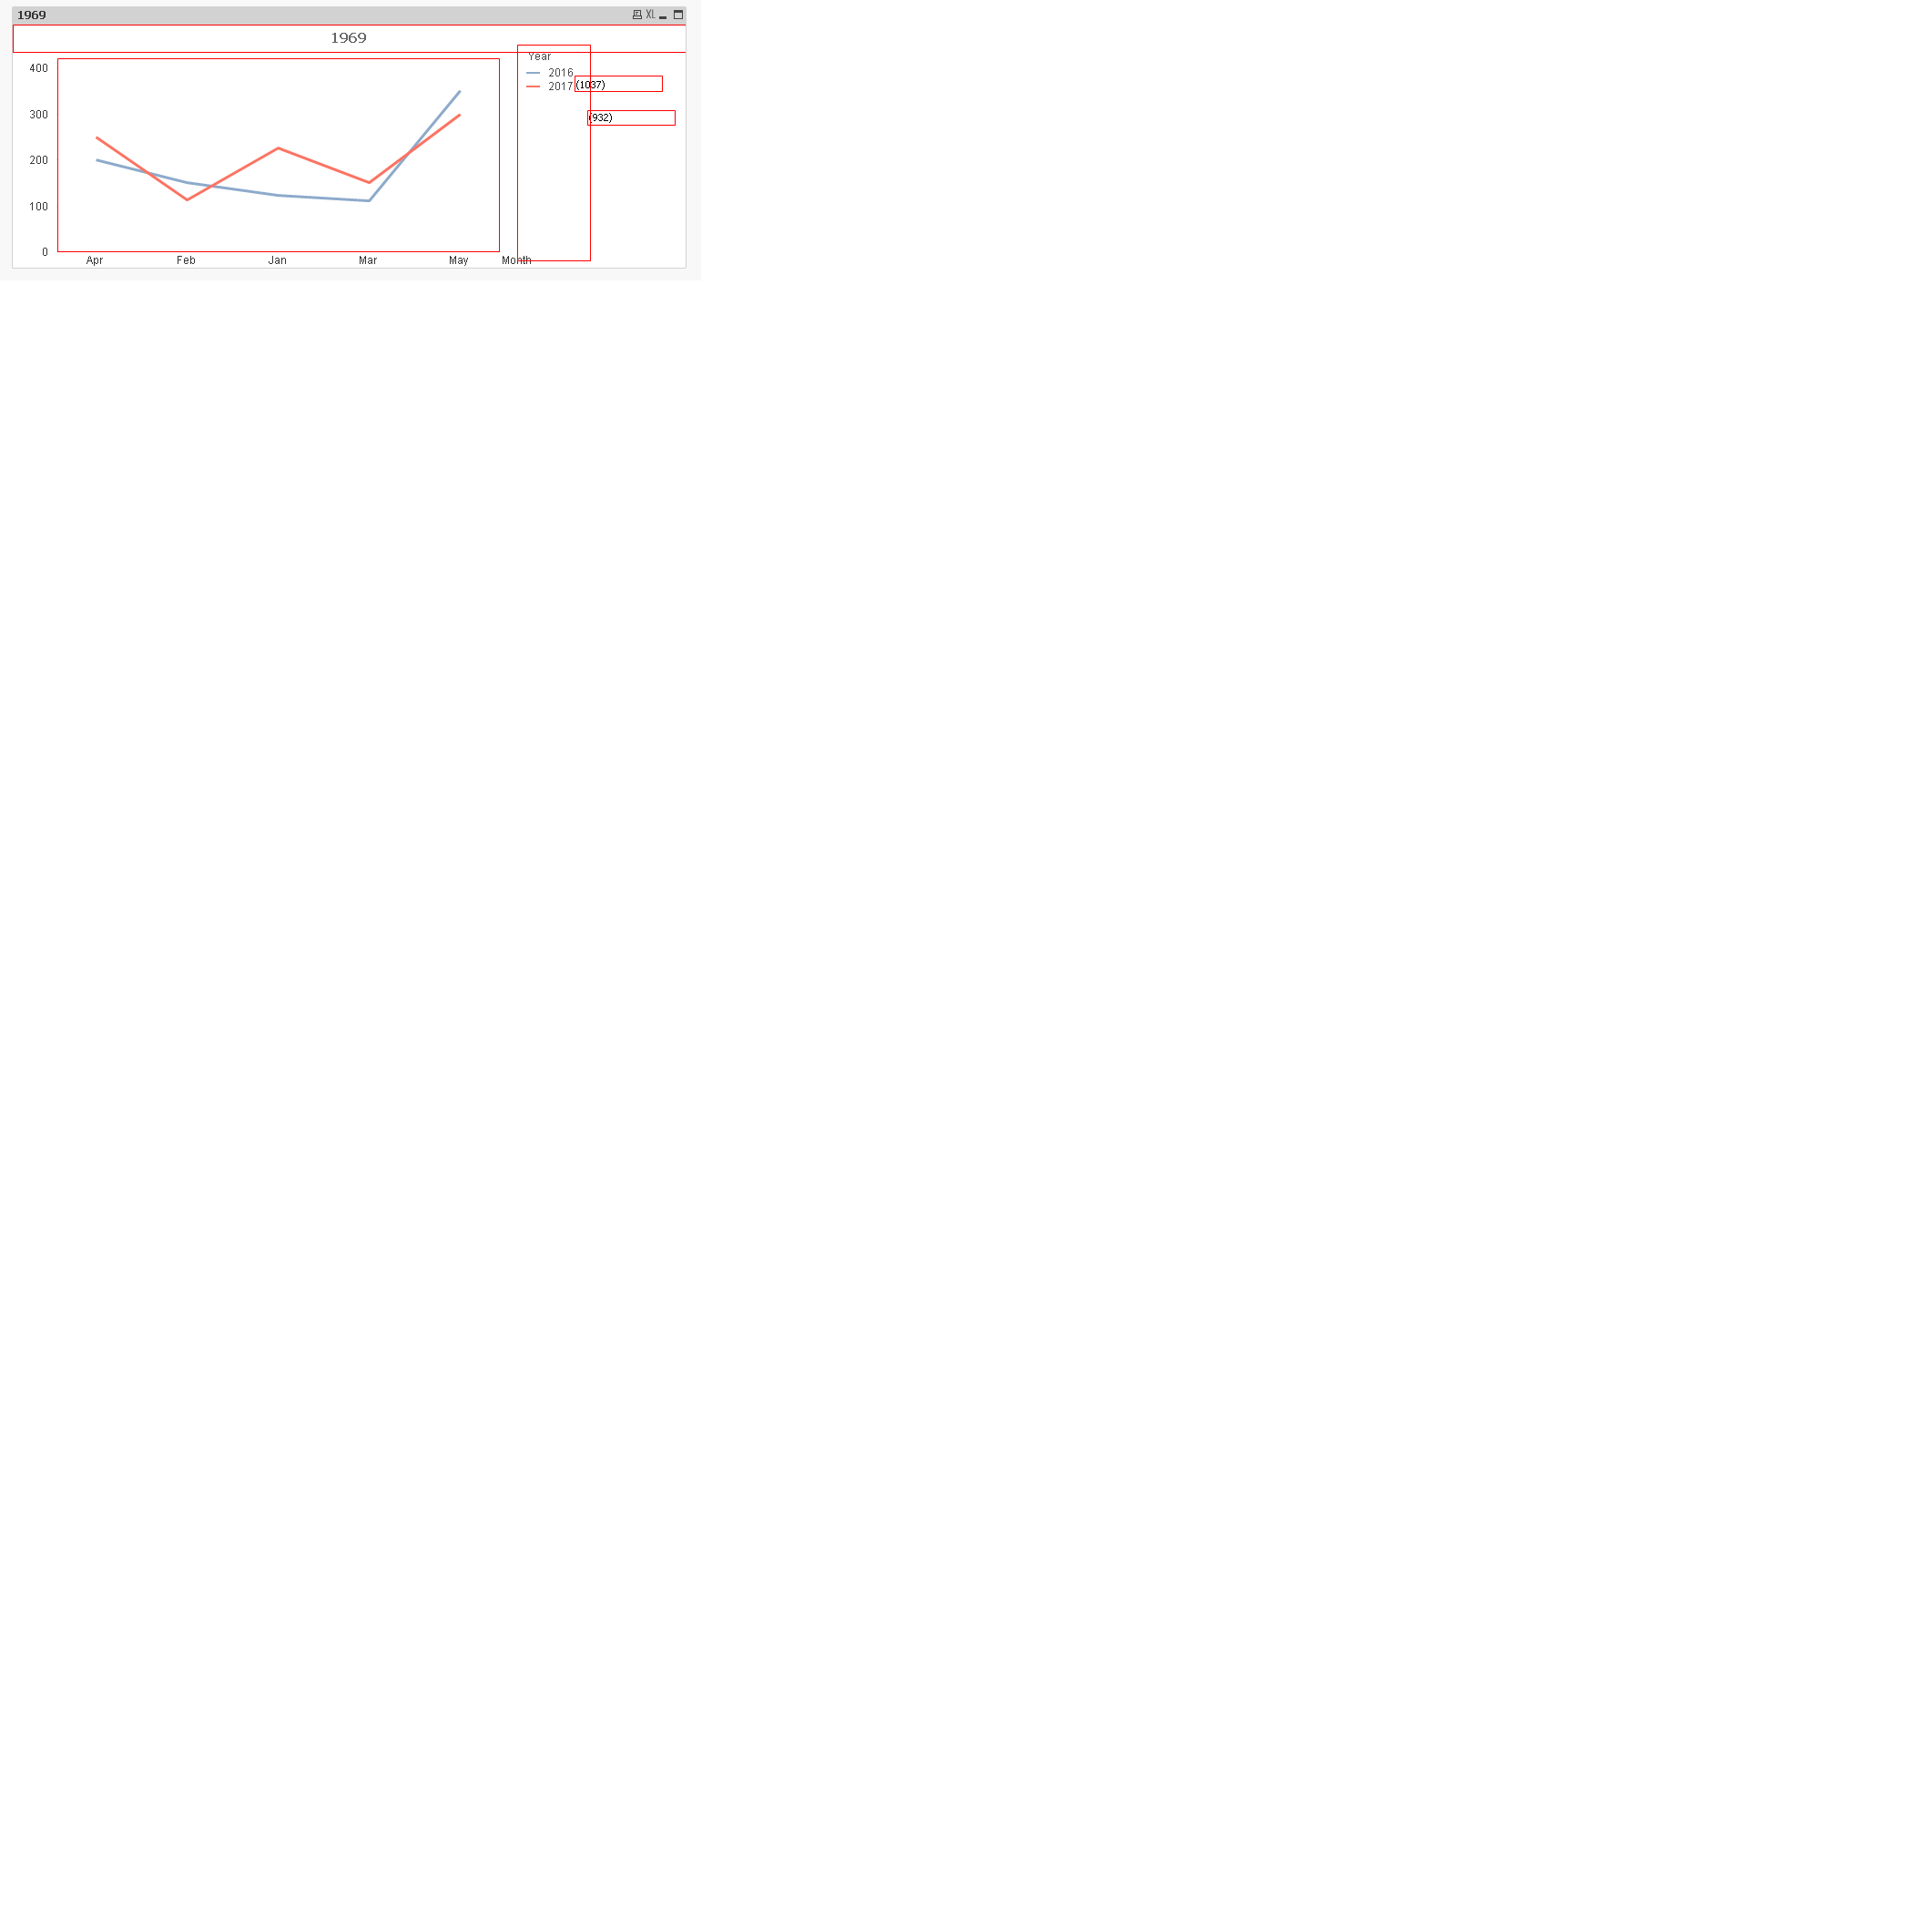
I have a Line Chart for sum amount for each month and year, my legend is year and i need to show the total in legend for each year.
I Attach the image and need to put in the red box the total.
Is that possible? Thanks


 vishsaggi
- Mark as New
- Bookmark
- Subscribe
- Mute
- Subscribe to RSS Feed
- Permalink
- Report Inappropriate Content
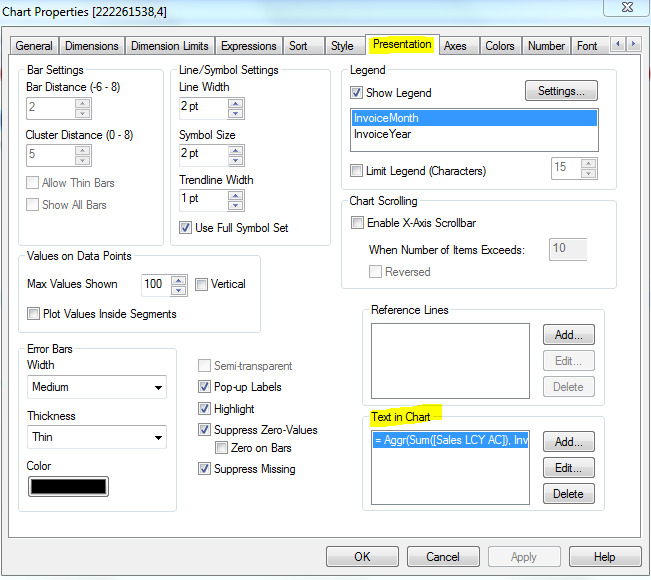
In your Chart properties -> Presentation tab -> Got to text in chart and add your expression.
=Aggr(Sum(Yourfield), YourYearField)
Like here:
jose_vargas
- Mark as New
- Bookmark
- Subscribe
- Mute
- Subscribe to RSS Feed
- Permalink
- Report Inappropriate Content
Hello, its no work... When i did that, the value show in chart, i need yo show the value in text legend, next to the year in my case.
vishsaggi
- Mark as New
- Bookmark
- Subscribe
- Mute
- Subscribe to RSS Feed
- Permalink
- Report Inappropriate Content
Can you share a sample app to look into?
jose_vargas
- Mark as New
- Bookmark
- Subscribe
- Mute
- Subscribe to RSS Feed
- Permalink
- Report Inappropriate Content
Yes.. Look the legend "Año" (year), i want to show the sum of each year.

vishsaggi
- Mark as New
- Bookmark
- Subscribe
- Mute
- Subscribe to RSS Feed
- Permalink
- Report Inappropriate Content
Check here? Use the sum expression in your Presentation tab Text in chart Add these expressions and drag them to the legend.
= '(' & Sum({< Ano = {'2016'}>} YourExprField) & ')'
= '(' & Sum({< Ano = {'2017'}>} YourExprField) & ')' .....
See attached. Then using ctrl+Shift you will see different Graph objects with Red rectangles like image below, then you can move those numbers to their respective year legend.