Unlock a world of possibilities! Login now and discover the exclusive benefits awaiting you.

Announcements
Talend Cloud AWS EU Scheduled Outage: Starting Tues 26 May 21:00 CEST with expected completion Wed 27 May 01:00 CEST
- Qlik Community
- :
- All Forums
- :
- QlikView
- :
- Showing Common Selections Between 2 Alternate Stat...
Options
- Subscribe to RSS Feed
- Mark Topic as New
- Mark Topic as Read
- Float this Topic for Current User
- Bookmark
- Subscribe
- Mute
- Printer Friendly Page
Turn on suggestions
Auto-suggest helps you quickly narrow down your search results by suggesting possible matches as you type.
Showing results for

Not applicable
2016-07-20
11:40 AM
- Mark as New
- Bookmark
- Subscribe
- Mute
- Subscribe to RSS Feed
- Permalink
- Report Inappropriate Content
Showing Common Selections Between 2 Alternate States
Hi! I have 2 charts created with 2 list boxes set as different alternate states. I'm trying to figure out a way to display the common attributes that are selected between these two states in a text object, as well as the number of common attributes.
Is there a workaround for this? Attached is the sample qvw.
Thanks!
Anna
981 Views
1 Solution
Accepted Solutions

 sunny_talwar
MVP
2016-07-20
11:46 AM
- Mark as New
- Bookmark
- Subscribe
- Mute
- Subscribe to RSS Feed
- Permalink
- Report Inappropriate Content
This?
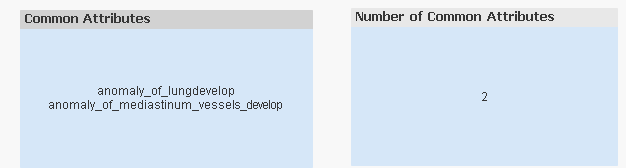
Expressions:
1) =Concat(DISTINCT {Cohort1*Cohort2} Attribute, Chr(10))
2) =Count(DISTINCT {Cohort1*Cohort2} Attribute)
907 Views
2 Replies
sunny_talwar
MVP
2016-07-20
11:46 AM
- Mark as New
- Bookmark
- Subscribe
- Mute
- Subscribe to RSS Feed
- Permalink
- Report Inappropriate Content
This?
Expressions:
1) =Concat(DISTINCT {Cohort1*Cohort2} Attribute, Chr(10))
2) =Count(DISTINCT {Cohort1*Cohort2} Attribute)
908 Views
Not applicable
2016-07-20
12:06 PM
Author
- Mark as New
- Bookmark
- Subscribe
- Mute
- Subscribe to RSS Feed
- Permalink
- Report Inappropriate Content
Thank you!!
907 Views