Unlock a world of possibilities! Login now and discover the exclusive benefits awaiting you.

- Qlik Community
- :
- All Forums
- :
- QlikView
- :
- Sorting and using colors in Pivot Table
- Subscribe to RSS Feed
- Mark Topic as New
- Mark Topic as Read
- Float this Topic for Current User
- Bookmark
- Subscribe
- Mute
- Printer Friendly Page

 kris_vliegen
- Mark as New
- Bookmark
- Subscribe
- Mute
- Subscribe to RSS Feed
- Permalink
- Report Inappropriate Content
Sorting and using colors in Pivot Table
Hi All,
I have a pivot table.
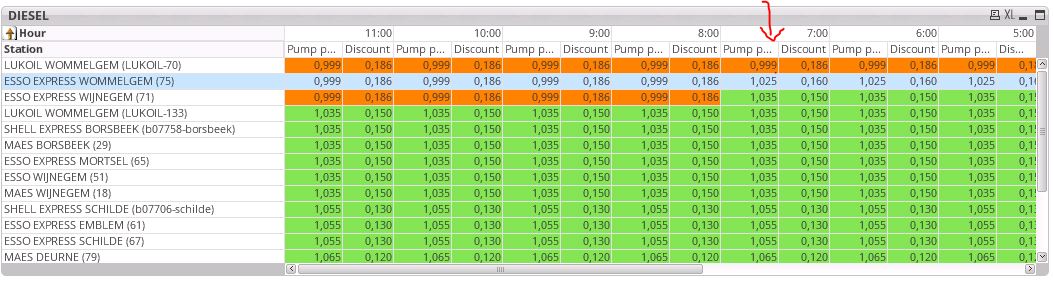
I have a reference-station (collored in blue).
And if the pumpprice of an our for a station is equal to the pummprice of the reverence station it should color Orange, If it's more than I would like to see it in green and if the rpice is lower than than the price of the reference-station it should color red.
Now I do someting like this
=if(Site_Id_Name = Site_Id_NameEigen, rgb(195,227,255),
if (round(avg(Pump_price),0.001) > round(avg(TOTAL <_CalYear, _CalMonth, _CalDay> {<Site_Id_Name={"$(=vEigenStation)"} , _CalYearHour={"$(=vMaxDateHour)"} >}Pump_price),0.001), rgb(129,226,82),
if (round(avg(Pump_price),0.001) = round(avg(TOTAL <_CalYear, _CalMonth, _CalDay> {<Site_Id_Name={"$(=vEigenStation)"} , _CalYearHour={"$(=vMaxDateHour)"} >}Pump_price),0.001), rgb(255,128,0), rgb(240,102,68))))
But it isn't working for the hours.
How can I solve this?
And I would also like to sort on the highest hour.
Regards,
Kris
- Tags:
- pivot table sorting
