Unlock a world of possibilities! Login now and discover the exclusive benefits awaiting you.

- Qlik Community
- :
- All Forums
- :
- QlikView
- :
- Stacked bar chart issue
- Subscribe to RSS Feed
- Mark Topic as New
- Mark Topic as Read
- Float this Topic for Current User
- Bookmark
- Subscribe
- Mute
- Printer Friendly Page

 vlad_komarov
- Mark as New
- Bookmark
- Subscribe
- Mute
- Subscribe to RSS Feed
- Permalink
- Report Inappropriate Content
Stacked bar chart issue
I have a request to display sales data as a stacked bar chart per Sales Period per Place of Service.
I was able to create a chart for two 12 months periods where time periods are placed side-by-side:
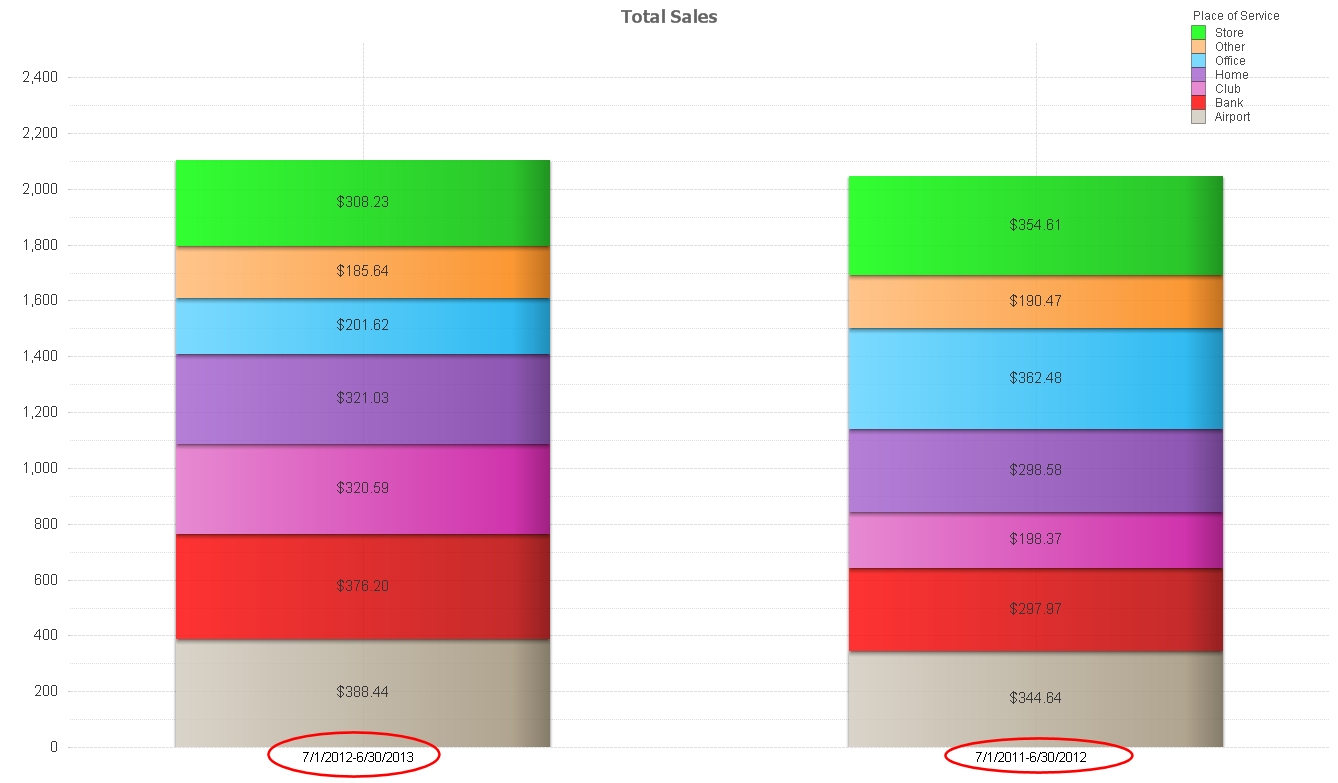
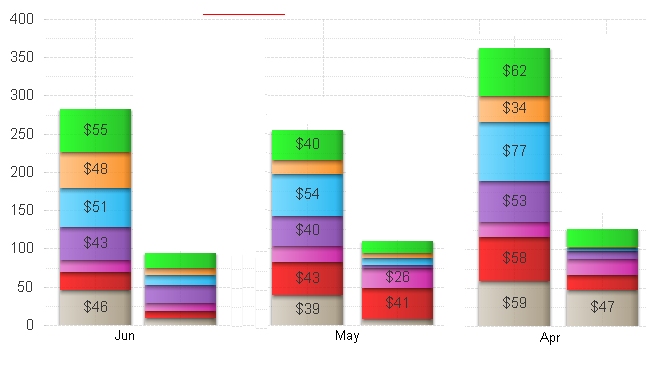
But I also need to do the same chart per Month during these time periods. Something like that:
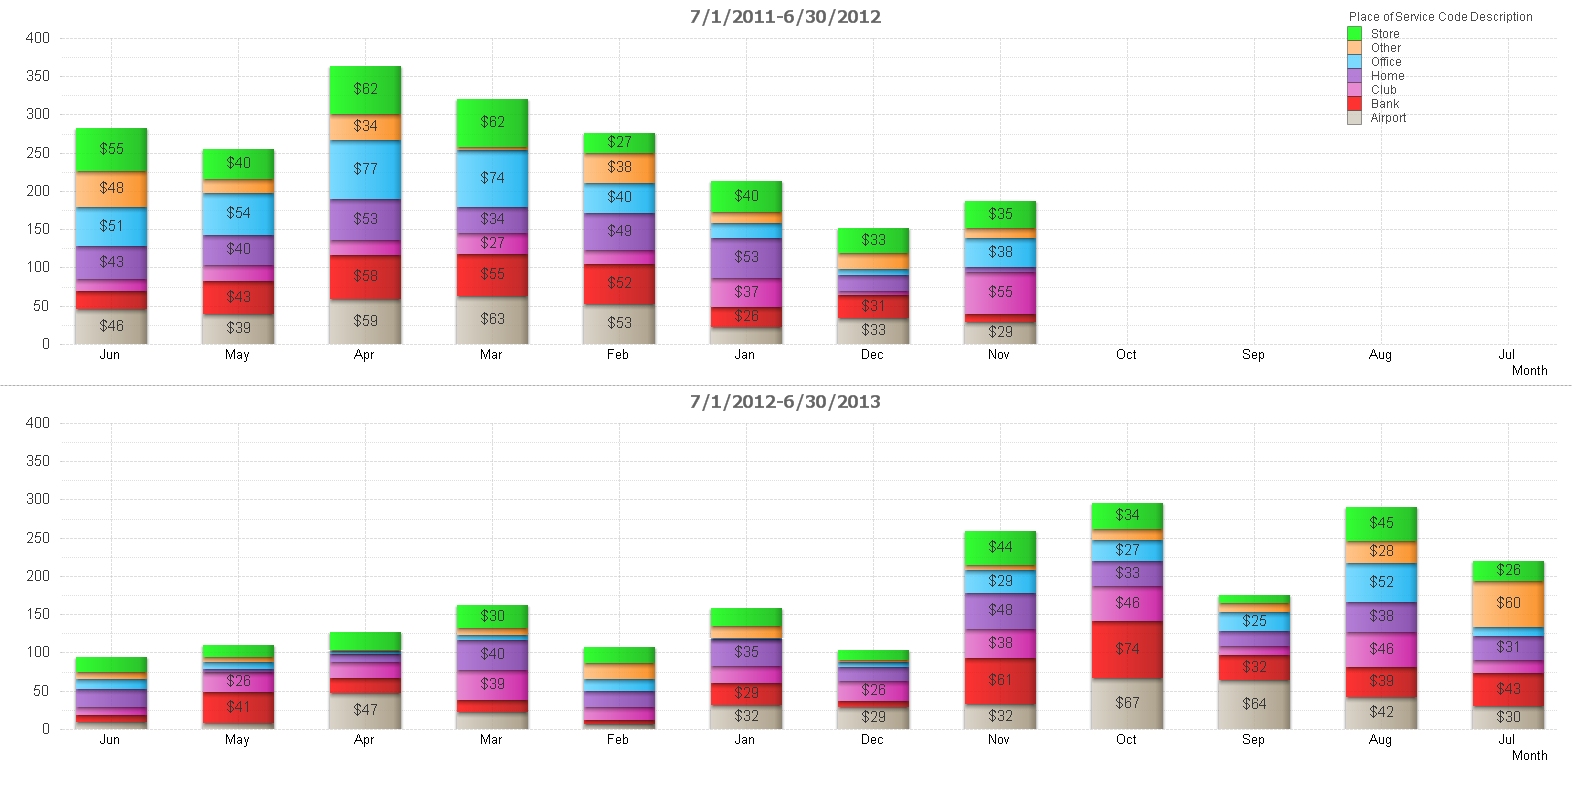
But the only way I was able to do something similar was with using Trellis option:
Any suggestions about how to create a desirable chart (#2 image above)?
Will appreciate any suggestions.
Best regards,
Vladimir
My sample application is attached.
Accepted Solutions

 Clever_Anjos
- Mark as New
- Bookmark
- Subscribe
- Mute
- Subscribe to RSS Feed
- Permalink
- Report Inappropriate Content
Clever_Anjos
- Mark as New
- Bookmark
- Subscribe
- Mute
- Subscribe to RSS Feed
- Permalink
- Report Inappropriate Content
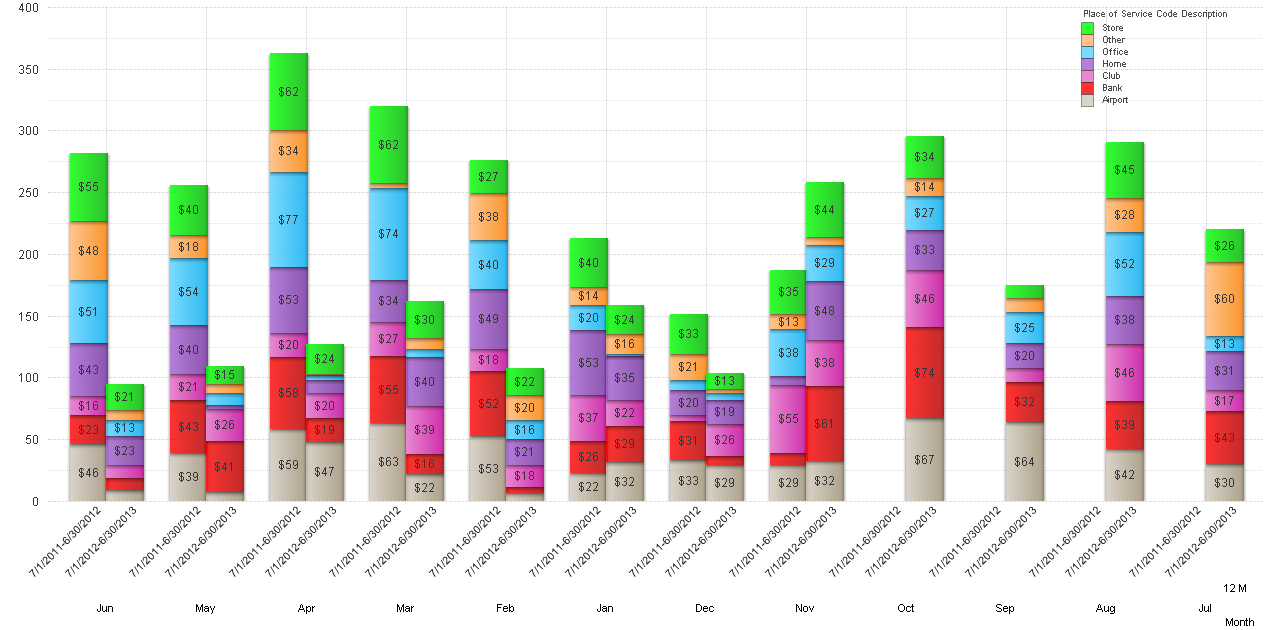
Try to remove Trellis and promote your month to be first dimension
vlad_komarov
- Mark as New
- Bookmark
- Subscribe
- Mute
- Subscribe to RSS Feed
- Permalink
- Report Inappropriate Content
Good call, Clever!
I thought I've tried all options but missed this one somehow....
Thank you!
VK
