Unlock a world of possibilities! Login now and discover the exclusive benefits awaiting you.
- Qlik Community
- :
- All Forums
- :
- QlikView
- :
- Suming a %
- Subscribe to RSS Feed
- Mark Topic as New
- Mark Topic as Read
- Float this Topic for Current User
- Bookmark
- Subscribe
- Mute
- Printer Friendly Page
- Mark as New
- Bookmark
- Subscribe
- Mute
- Subscribe to RSS Feed
- Permalink
- Report Inappropriate Content
Suming a %
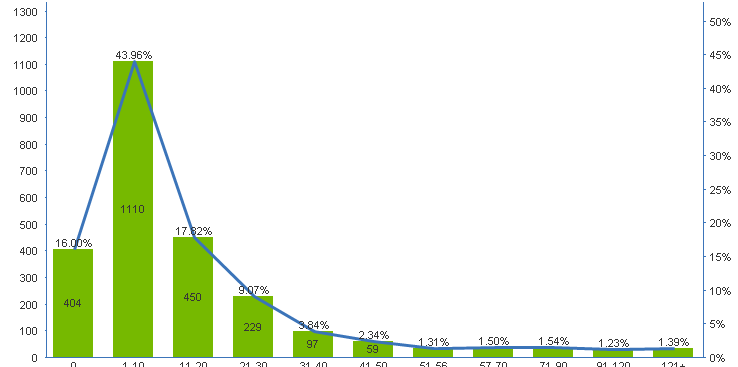
Hi i have this graph and i want to be able to sum the first 7 buckets of the percent.
So i can see the total percentage which meets the target. Is this possible as i just cant seem to be able to work it out.
it does not have to be on the same graph just either list box, or a chart where it just displayed the number as an led number
- Mark as New
- Bookmark
- Subscribe
- Mute
- Subscribe to RSS Feed
- Permalink
- Report Inappropriate Content
Well, you give very few information to help you on this, it's always a good idea to copy the dimensions and expressions into your posting, or at best attach a small sample that demonstrate your problem.
Your image is also cut off at the lower end.
Anyway, it seems that you are using a classification like '1-10' for your buckets, probably you are using some if() functions in the script or as calculated dimension to create your buckets based on -- what? Maybe a count of Orders or something? And then the expression might calculate the count of distinct customers.
You see I am totally guessing, so please try to give as much information as feasible.
So, if your dimension looks like (shortened the list of buckets here):
= aggr( if( count(Orders) =0,'0', if(count(Orders) <=10, '1-10','>10')), Customer)
and your expression is
=count(distinct Customer)
the first 7 buckets in your example will range from a 0 to 56 count, so you could calculate the total distinct Customer count for this group like
=count({<Customer = {"=count(Orders)<=56"}>} distinct Customer)
If you want a percentage, you need to devide by the total distinct count of all Customers:
=count({<Customer = {"=count(Orders)<=56"}>} distinct Customer) / count( distinct Customer)