Unlock a world of possibilities! Login now and discover the exclusive benefits awaiting you.

Announcements
Share your agentic AI experience, learn from others, and earn a new badge: Put Agentic AI to Work
- Qlik Community
- :
- All Forums
- :
- QlikView
- :
- Summary in Scatter Chart
Options
- Subscribe to RSS Feed
- Mark Topic as New
- Mark Topic as Read
- Float this Topic for Current User
- Bookmark
- Subscribe
- Mute
- Printer Friendly Page
Turn on suggestions
Auto-suggest helps you quickly narrow down your search results by suggesting possible matches as you type.
Showing results for

Not applicable
2013-04-02
06:59 AM
- Mark as New
- Bookmark
- Subscribe
- Mute
- Subscribe to RSS Feed
- Permalink
- Report Inappropriate Content
Summary in Scatter Chart
Hi
In my scatter chart I display the number of created notifications in a picture of a machine.
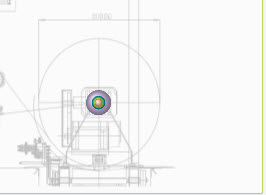
The machine id divided in many parts and the x and y coordinates have to be with very small increments. Sort field is coming from SAP/R3.
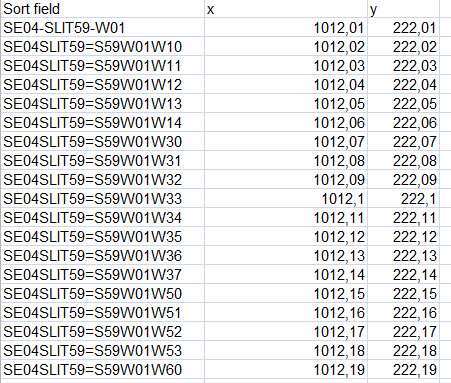
What I want is to display all notifications created for x 1012 and y 222 as one summarized blob, not as many blobs at (almost) the same place as in the upper pic.
Best regards
/Mats
- Tags:
- new_to_qlikview
325 Views
0 Replies