Unlock a world of possibilities! Login now and discover the exclusive benefits awaiting you.

- Qlik Community
- :
- All Forums
- :
- QlikView
- :
- Table or Pivot with dynamic columns
- Subscribe to RSS Feed
- Mark Topic as New
- Mark Topic as Read
- Float this Topic for Current User
- Bookmark
- Subscribe
- Mute
- Printer Friendly Page

- Mark as New
- Bookmark
- Subscribe
- Mute
- Subscribe to RSS Feed
- Permalink
- Report Inappropriate Content
Table or Pivot with dynamic columns
Hi all,
I would like to create a table or pivot which has a dynamic list of columns. I'm connecting QV to a sharepoint list and if a new column is added to the list, I would like it to automatically appear on the dashboard. I can get the data in script (as I am doing a Load * from..) but is there a way to make the columns dynamic?
e.g.
SharePoint file might have:
FirstName,
Surname,
Age
but if they add a new column like 'hair colour' to the list I would like my dashboard table to now show:
FirstName
Surname
Age
Hair Colour
Many thanks

 sunny_talwar
- Mark as New
- Bookmark
- Subscribe
- Mute
- Subscribe to RSS Feed
- Permalink
- Report Inappropriate Content
Try this method may be:
Script:
Table:
LOAD * Inline [
Dim1, Dim2, Dim3, Value
A, AA, ABC, 10
A, AB, DEF, 20
B, AA, DEF, 30
B, AB, ABC, 20
];
Table2:
LOAD * Inline [
Column
Dim1
Dim2
Dim3
];
Maintain a separate list of Columns in Table2 (for example)
and then use this as your calculated dimensions:
=$(=SubField(Concat(DISTINCT Column, '|'), '|', 1))
=$(=SubField(Concat(DISTINCT Column, '|'), '|', 2))
=$(=SubField(Concat(DISTINCT Column, '|'), '|', 3))
=$(=SubField(Concat(DISTINCT Column, '|'), '|', 4))
=$(=SubField(Concat(DISTINCT Column, '|'), '|', 5))
.
.
.
Create as many as you think you might need, but restrict them with a show hide condition, such as this:
=Count(DISTINCT Column) >= 1
=Count(DISTINCT Column) >= 2
=Count(DISTINCT Column) >= 3
=Count(DISTINCT Column) >= 4
=Count(DISTINCT Column) >= 5
.
.
.
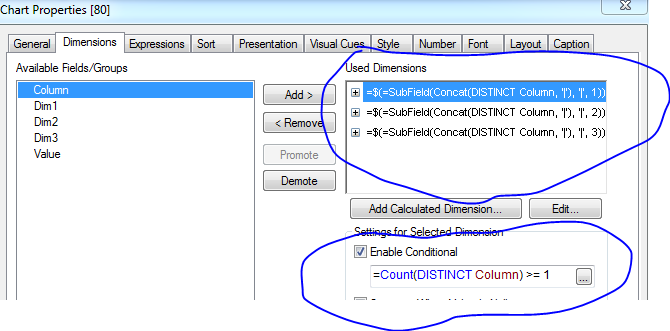
 marcus_sommer
- Mark as New
- Bookmark
- Subscribe
- Mute
- Subscribe to RSS Feed
- Permalink
- Report Inappropriate Content
This would be only work if you used variables as dimension which grab the first, second ... column from a certain table and if there aren't enough columns the n-variables will be return an invalid value which could be catched in a dimension-condition. But do not recommend such (automatically) approach - pivot-table are quite performance-intensive and shouldn't have a random number of columns.
Better are approaches like this: User Controlled Charts In QlikView and if you looked here https://community.qlik.com/search.jspa?q=dynamic+charts&type=document you will find many more ideas and solutions.
- Marcus