Unlock a world of possibilities! Login now and discover the exclusive benefits awaiting you.

- Qlik Community
- :
- All Forums
- :
- QlikView
- :
- Time Slider to replace variable extension boxes
- Subscribe to RSS Feed
- Mark Topic as New
- Mark Topic as Read
- Float this Topic for Current User
- Bookmark
- Subscribe
- Mute
- Printer Friendly Page

- Mark as New
- Bookmark
- Subscribe
- Mute
- Subscribe to RSS Feed
- Permalink
- Report Inappropriate Content
Time Slider to replace variable extension boxes
Is there any time slider or drop-down button for Date dimensions in Qlik Sense to replace Variable Extension boxes?
For example, I have a report with the following look (Dimension = "Date", Metric = Sum(Sales)):
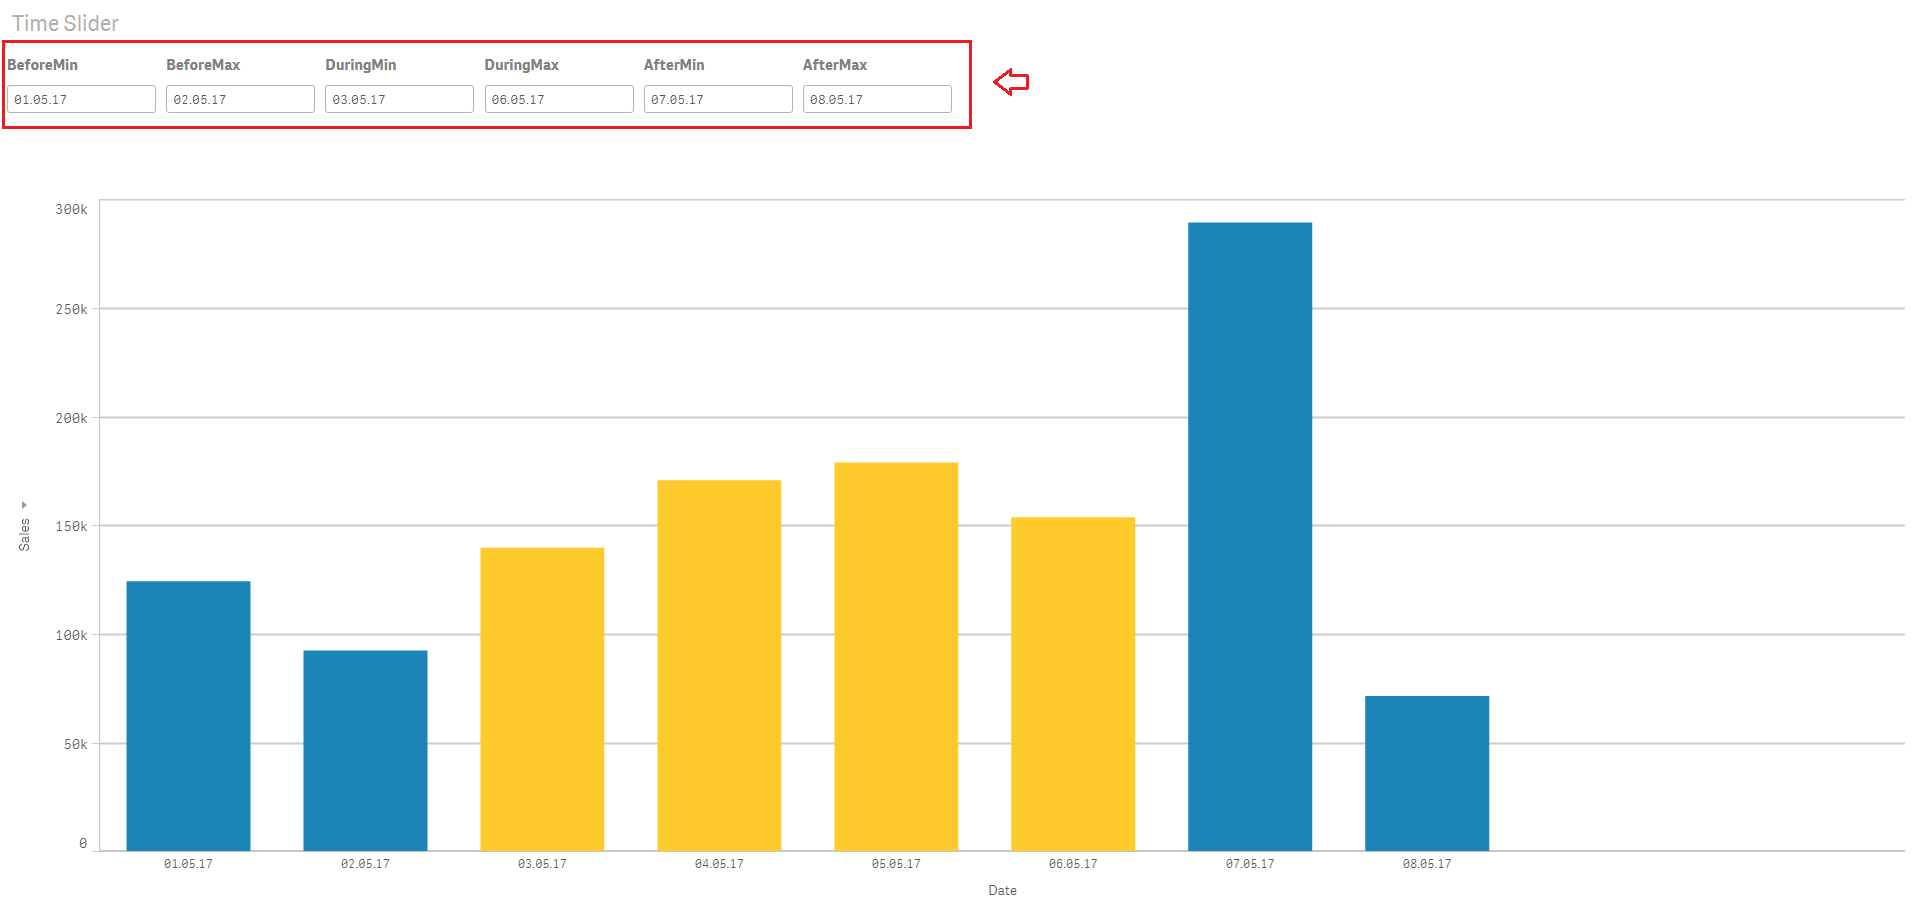
The graph uses variable extension boxes: "BeforeMin" ("vBDA_1" variable), "BeforeMax" ("vBDA_2" variable), "DuringMin" ("vBDA_3" variable), "DuringMax" ("vBDA_4" variable), "AfterMin" ("vBDA_5" variable), and "AfterMax" ("vBDA_6" variable) as inputs to generate its visualization in the "Appearance" tab, "Color by expression" option:
if( (Date >= date#(vBDA_3,'DD.MM.YY') and Date <= date#(vBDA_4,'DD.MM.YY')), RGB(255,202,43), RGB(27,133,184) )
I attach a 100% reproducible example of this report. any help/idea would be highly appreciated. Anibal