Unlock a world of possibilities! Login now and discover the exclusive benefits awaiting you.

- Qlik Community
- :
- All Forums
- :
- QlikView
- :
- Top 10 Year On Year
- Subscribe to RSS Feed
- Mark Topic as New
- Mark Topic as Read
- Float this Topic for Current User
- Bookmark
- Subscribe
- Mute
- Printer Friendly Page

 dmac1971
- Mark as New
- Bookmark
- Subscribe
- Mute
- Subscribe to RSS Feed
- Permalink
- Report Inappropriate Content
Top 10 Year On Year
I have two tables, one for 2012 and one for 2013 showing top 10 customers. The problem is that the 2012 will only show the top 9 customers, I suspect the reason is that the 10th customer for 2012 is not in the top 10 for 2013 so its now being shown? Any ideas how to fix, everything else is working correctly!!
- Tags:
- new_to_qlikview
Accepted Solutions

- Mark as New
- Bookmark
- Subscribe
- Mute
- Subscribe to RSS Feed
- Permalink
- Report Inappropriate Content
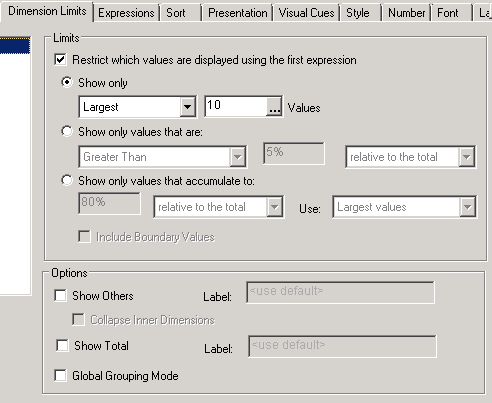
If you are using a straight table on QV 11, you can do this :
- In dimension tab, choose only Customer dimension.
- In dimension limits, choose to restrict the values and show only the 10 largest values and not show the others
- Then keep your expression.
- Mark as New
- Bookmark
- Subscribe
- Mute
- Subscribe to RSS Feed
- Permalink
- Report Inappropriate Content
Hello,
For your Top 10 tables, did you use Dimension limits or a set analysis ?
Quentin
dmac1971
- Mark as New
- Bookmark
- Subscribe
- Mute
- Subscribe to RSS Feed
- Permalink
- Report Inappropriate Content
Dimension Limits :
=if(aggr(rank(sum([Sales])),[Customer])<=10,[Customer])
The expression then limits sales to 2012 :
=Sum({<[Year] = {"2012"}>}[Sales])
Should I be limiting the sales year within the dimension?
- Mark as New
- Bookmark
- Subscribe
- Mute
- Subscribe to RSS Feed
- Permalink
- Report Inappropriate Content
If you are using a straight table on QV 11, you can do this :
- In dimension tab, choose only Customer dimension.
- In dimension limits, choose to restrict the values and show only the 10 largest values and not show the others
- Then keep your expression.
dmac1971
- Mark as New
- Bookmark
- Subscribe
- Mute
- Subscribe to RSS Feed
- Permalink
- Report Inappropriate Content
Perfect, thanks QB!!!!
- Mark as New
- Bookmark
- Subscribe
- Mute
- Subscribe to RSS Feed
- Permalink
- Report Inappropriate Content
Did you try:
=if(aggr(rank(sum({<[Year] = {"2012"}>} [Sales])),[Customer])<=10,[Customer])
You select the top 10 customers based on the selection, and you sum your sales based on 2012.
Fabrice