Unlock a world of possibilities! Login now and discover the exclusive benefits awaiting you.
- Qlik Community
- :
- All Forums
- :
- QlikView
- :
- Top 10 customers
- Subscribe to RSS Feed
- Mark Topic as New
- Mark Topic as Read
- Float this Topic for Current User
- Bookmark
- Subscribe
- Mute
- Printer Friendly Page
- Mark as New
- Bookmark
- Subscribe
- Mute
- Subscribe to RSS Feed
- Permalink
- Report Inappropriate Content
Top 10 customers
Edited by Qlik Community Member:
Please post in English unless you are in a dedicated language section.
Post translated by Google Translate.
---
Hi all,
I'm starting my first steps in QlikView and suddenly I find myself trapped in something that looks siemple but can not find how. I need to create a list of the top 10 customers. At first it seems siemple because vast to create the dimension "Client", using a Sum ({<TPO = {'Sales'}, YEAR = {'$ (= vAñoActual)'}>} GROSS) function that I can get selected sales per year that is stored in vAñoActual variable and select "Mostar the first 10" in the "Limitations of the Dimension". The result is as follows:
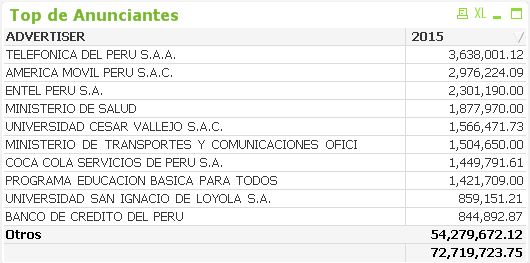
The problem is that the total shown does not correspond to the first 10 but the total of all customers.
There is way to show the total amount corresponding to the sum of the 10 primermos?
Greetings!
- Tags:
- new_to_qlikview
- Mark as New
- Bookmark
- Subscribe
- Mute
- Subscribe to RSS Feed
- Permalink
- Report Inappropriate Content
Uncheck 'Show Others' in the dimension limit tab.
- Mark as New
- Bookmark
- Subscribe
- Mute
- Subscribe to RSS Feed
- Permalink
- Report Inappropriate Content
try below
Category= aggr(if(rank(sum(sales))<= 10, 'Top 10', 'Others'),name)
Top 10 Customers = aggr(if(rank((sales))<=10,name,'Others'),name)
- Mark as New
- Bookmark
- Subscribe
- Mute
- Subscribe to RSS Feed
- Permalink
- Report Inappropriate Content
I think you need to customize your chart Using Rank function to achieve the same.
See the below link
- Mark as New
- Bookmark
- Subscribe
- Mute
- Subscribe to RSS Feed
- Permalink
- Report Inappropriate Content
HI,
Try Unchecking the 'Show Others' option in the Dimension limits tab.
Regards,
Jagan.
- Mark as New
- Bookmark
- Subscribe
- Mute
- Subscribe to RSS Feed
- Permalink
- Report Inappropriate Content
Hello,
Try this
In Dimensions Limit Tab : Remove Show Other and Show Total
In Expression Tab at Total Mode : Check the Sum of rows (The last option)
Regards
Gilles
- Mark as New
- Bookmark
- Subscribe
- Mute
- Subscribe to RSS Feed
- Permalink
- Report Inappropriate Content
in 'Dimensions Limits ' tab,
1) Uncheck the 'Show Others' option
2) Select the 'Largest' option rather than 'First'