Unlock a world of possibilities! Login now and discover the exclusive benefits awaiting you.
- Qlik Community
- :
- All Forums
- :
- QlikView
- :
- Total Of Rows of Pivot Table
- Subscribe to RSS Feed
- Mark Topic as New
- Mark Topic as Read
- Float this Topic for Current User
- Bookmark
- Subscribe
- Mute
- Printer Friendly Page
- Mark as New
- Bookmark
- Subscribe
- Mute
- Subscribe to RSS Feed
- Permalink
- Report Inappropriate Content
Total Of Rows of Pivot Table
Hello All,
I have pivot table. Dimension 1= Year Dimension 2= Brand.
Expression is count( distinct ItemID).
YEAR Brand1 Brand2 Brand3 TOTAL
2011 2 5 6 10
2012 1 6 9 13
Now the issue is that the Total in Pivot is taking the expression as count( Distinct ItemID).
How can i have total 2011 = 11, and 2012 = 16.
Thanks
- « Previous Replies
-
- 1
- 2
- Next Replies »
- Mark as New
- Bookmark
- Subscribe
- Mute
- Subscribe to RSS Feed
- Permalink
- Report Inappropriate Content
Hi King,
Can you please try this one in your Expression tab.
Thanks and Regards
Sovan
- Mark as New
- Bookmark
- Subscribe
- Mute
- Subscribe to RSS Feed
- Permalink
- Report Inappropriate Content
Hi,
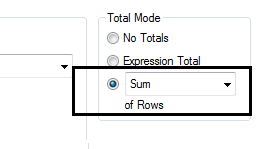
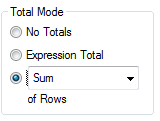
Yes you can use the Sum of Rows option in Chart properties >> Expression >> Total Mode.
Regards
Anand
- Mark as New
- Bookmark
- Subscribe
- Mute
- Subscribe to RSS Feed
- Permalink
- Report Inappropriate Content
This is for straight table not for pivot.
- Mark as New
- Bookmark
- Subscribe
- Mute
- Subscribe to RSS Feed
- Permalink
- Report Inappropriate Content
Hi,
Post you sample data and expected o/p.
Regards
ASHFAQ
- Mark as New
- Bookmark
- Subscribe
- Mute
- Subscribe to RSS Feed
- Permalink
- Report Inappropriate Content
You can't have such report with straight table.
Regards
ASHFAQ
- Mark as New
- Bookmark
- Subscribe
- Mute
- Subscribe to RSS Feed
- Permalink
- Report Inappropriate Content
You have to use AGGR.
sum(Aggr(Count(Distinct ItemID),Year,BrandID))
- Mark as New
- Bookmark
- Subscribe
- Mute
- Subscribe to RSS Feed
- Permalink
- Report Inappropriate Content
Hi King,
Try this expression
=Sum(Aggr(count( Distinct ItemID), Brand))
Hope this helps you.
Regards,
Jagan.
- Mark as New
- Bookmark
- Subscribe
- Mute
- Subscribe to RSS Feed
- Permalink
- Report Inappropriate Content
Sample..
For Year 2012 it should be 4 not 3.
- Mark as New
- Bookmark
- Subscribe
- Mute
- Subscribe to RSS Feed
- Permalink
- Report Inappropriate Content
Hi,
In expression use Aggregation like
=Sum( Aggr( Count( DISTINCT ID),Brand,Year)) //because it has dimension Brand andYear
Note:- if you add more dimension in the chart then you have to use it in the Aggregation expression also
Regards
Anand
- « Previous Replies
-
- 1
- 2
- Next Replies »