Unlock a world of possibilities! Login now and discover the exclusive benefits awaiting you.

Announcements
ALERT: QlikView server communication interruptions following Microsoft Windows Domain Controller security updates
- Qlik Community
- :
- All Forums
- :
- QlikView
- :
- Trellis in scatter chart
Options
- Subscribe to RSS Feed
- Mark Topic as New
- Mark Topic as Read
- Float this Topic for Current User
- Bookmark
- Subscribe
- Mute
- Printer Friendly Page
Turn on suggestions
Auto-suggest helps you quickly narrow down your search results by suggesting possible matches as you type.
Showing results for

 manideep78
Partner - Specialist
2016-04-29
03:32 AM
- Mark as New
- Bookmark
- Subscribe
- Mute
- Subscribe to RSS Feed
- Permalink
- Report Inappropriate Content
Trellis in scatter chart
Dear Community,
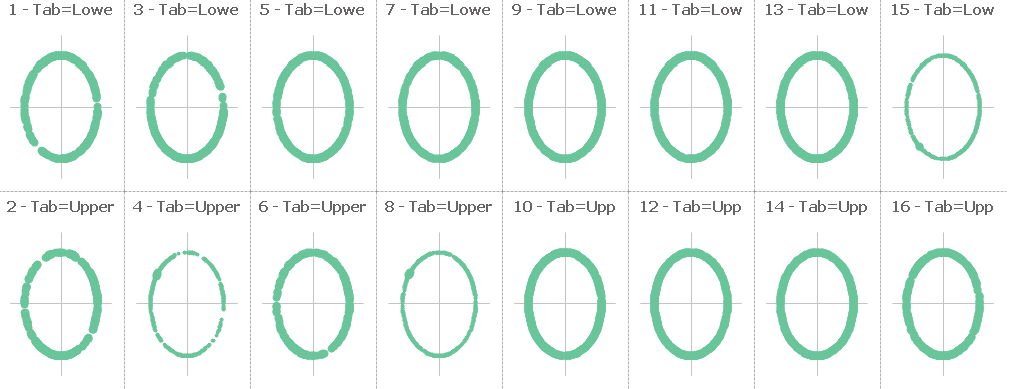
I have created a scatter chart with trellis and my chart look likes the below image:
When I apply some filters, the positions are changing and some are becoming empty like below image.
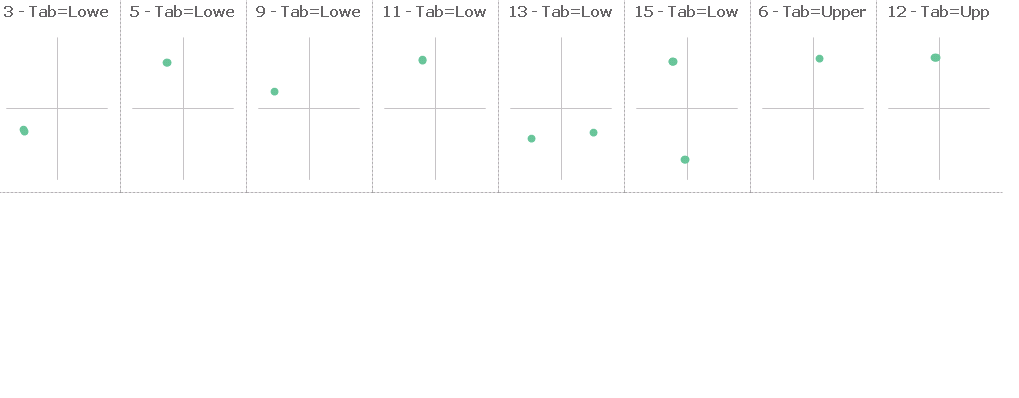
Is it possible that chart should remain same even though some places are empty.. and the dots should plot on the corresponding tab?
Thanks in advance.
Regards,
Manideep
697 Views
3 Replies
manideep78
Partner - Specialist
2016-04-29
05:42 AM
Author
- Mark as New
- Bookmark
- Subscribe
- Mute
- Subscribe to RSS Feed
- Permalink
- Report Inappropriate Content
Hello All,
Is there any possibility to achieve this?
548 Views

 Kushal_Chawda
MVP
2016-04-29
05:49 AM
- Mark as New
- Bookmark
- Subscribe
- Mute
- Subscribe to RSS Feed
- Permalink
- Report Inappropriate Content
How should be the chart look like after selection?
548 Views
manideep78
Partner - Specialist
2016-04-29
05:51 AM
Author
- Mark as New
- Bookmark
- Subscribe
- Mute
- Subscribe to RSS Feed
- Permalink
- Report Inappropriate Content
The same as the first image with all 16 tabsbut wherever the data exists there only the would be present. remaining tabs will be empty.
548 Views
