Unlock a world of possibilities! Login now and discover the exclusive benefits awaiting you.

Announcements
Share your agentic AI experience, learn from others, and earn a new badge: Put Agentic AI to Work
- Qlik Community
- :
- All Forums
- :
- QlikView
- :
- Re: Trend Line chart in a Pivot table
Options
- Subscribe to RSS Feed
- Mark Topic as New
- Mark Topic as Read
- Float this Topic for Current User
- Bookmark
- Subscribe
- Mute
- Printer Friendly Page
Turn on suggestions
Auto-suggest helps you quickly narrow down your search results by suggesting possible matches as you type.
Showing results for

Not applicable
2017-07-18
06:42 AM
- Mark as New
- Bookmark
- Subscribe
- Mute
- Subscribe to RSS Feed
- Permalink
- Report Inappropriate Content
Trend Line chart in a Pivot table
Hi,
Can we create a TREND LINE / CHART in a column based on month data into a pivot table? Below is the sample data. In column G I want to add a trend line showing the performance of the actual vs target. please advise if this is possible?
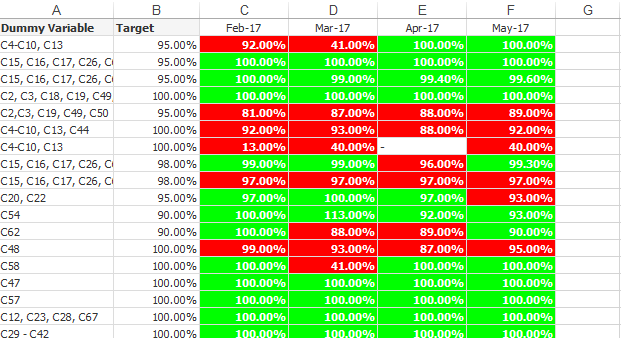
thanks
Sowjanya
- Tags:
- stevedark
3,511 Views
2 Replies

2017-07-18
06:51 AM
- Mark as New
- Bookmark
- Subscribe
- Mute
- Subscribe to RSS Feed
- Permalink
- Report Inappropriate Content
That may possible?
Steps followed
1) Go to G expression
2) There you will get Display options and choose Mini chart
3) go to mini chart settings - Dimension is month and click ok and ok and check
HTH
Anil
Best Anil, When applicable please mark the correct/appropriate replies as "solution" (you can mark up to 3 "solutions". Please LIKE threads if the provided solution is helpful
3,105 Views

 Kushal_Chawda
MVP
2017-07-18
06:56 AM
- Mark as New
- Bookmark
- Subscribe
- Mute
- Subscribe to RSS Feed
- Permalink
- Report Inappropriate Content