Unlock a world of possibilities! Login now and discover the exclusive benefits awaiting you.
- Qlik Community
- :
- All Forums
- :
- QlikView
- :
- Re: Value M vs Value M-1 in a table chart
- Subscribe to RSS Feed
- Mark Topic as New
- Mark Topic as Read
- Float this Topic for Current User
- Bookmark
- Subscribe
- Mute
- Printer Friendly Page
- Mark as New
- Bookmark
- Subscribe
- Mute
- Subscribe to RSS Feed
- Permalink
- Report Inappropriate Content
Value M vs Value M-1 in a table chart
Dear all,
I need to show in a table chart :
- inventory value of the current month in selection
- inventory value of the previous month
- Difference between M and M-1 inventory value
Thanks to some nice help, i have been able to show in a text object the inventory value of the provious month but as i am now trying to paste the formulas in a table chart, the value is shown but linked to the previous month...
let me show you :
For instance :
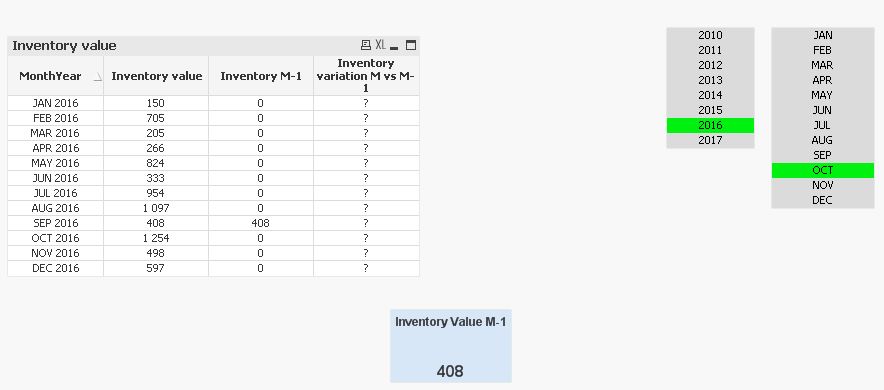
In october 2016 :
Inventory value is 1254
Inventory value of the previous month is 408 (september figure then)
Difference between M & M-1 is 846
Below is print screen of what i get : the text object is right but the data in the table chart is wrong
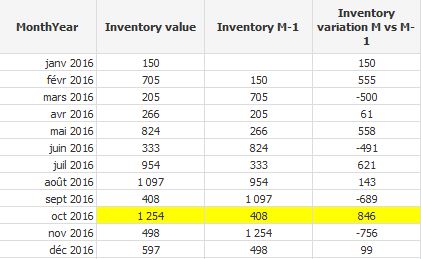
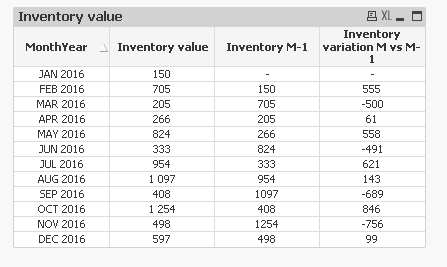
And this is what i am looking for :
Attached is .qvw and excel database for those who want to help
Thanks in advance
Guillaume
- « Previous Replies
- Next Replies »
Accepted Solutions
- Mark as New
- Bookmark
- Subscribe
- Mute
- Subscribe to RSS Feed
- Permalink
- Report Inappropriate Content
So, basically see the YTD? Try this
Above(Sum({$<Mois, Année, MonthYear>}[Inventory Value])) * Avg({$<MonthYear = {"$(='>=' & Date(YearStart(Max(MonthYear)), 'MMM YYYY') & '<=' & Date(Max(MonthYear), 'MMM YYYY'))"}, Mois, Année>} 1)
- Mark as New
- Bookmark
- Subscribe
- Mute
- Subscribe to RSS Feed
- Permalink
- Report Inappropriate Content
Use Above() function to get the previous dimension's value
Above(Sum ({$ <Mois= {JAN,FEB,MAR,APR,MAY,JUN,JUL,AUG,SEP,OCT,NOV,DEC}>}[Inventory Value]))
- Mark as New
- Bookmark
- Subscribe
- Mute
- Subscribe to RSS Feed
- Permalink
- Report Inappropriate Content
Sunny,
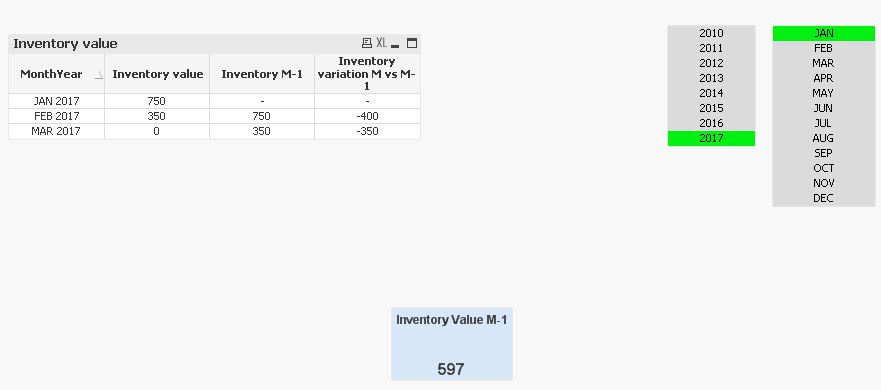
it does not seem to work when data are extended to the next year :
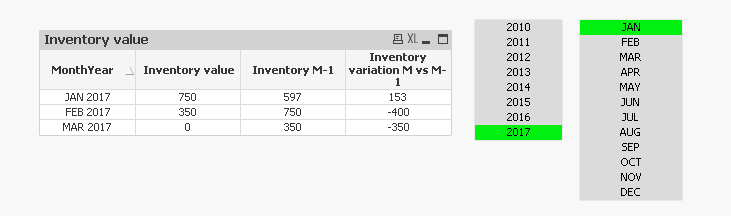
For instance i added 2017 in the test database and for january 2017, the formulas is not working although it should show 597 and 153
- Mark as New
- Bookmark
- Subscribe
- Mute
- Subscribe to RSS Feed
- Permalink
- Report Inappropriate Content
Slightly modified version of the expression
Above(Sum ({$ <Mois= {JAN,FEB,MAR,APR,MAY,JUN,JUL,AUG,SEP,OCT,NOV,DEC}, Année>}[Inventory Value])) * Avg({$ <Mois= {JAN,FEB,MAR,APR,MAY,JUN,JUL,AUG,SEP,OCT,NOV,DEC}>} 1)
- Mark as New
- Bookmark
- Subscribe
- Mute
- Subscribe to RSS Feed
- Permalink
- Report Inappropriate Content
Synny your are fantastic.
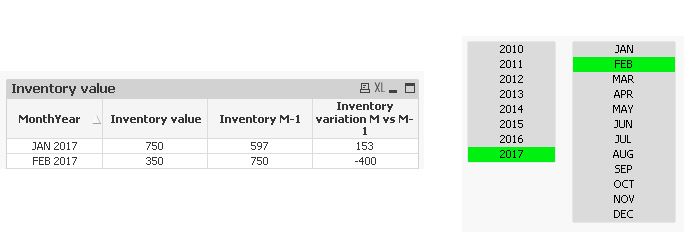
One last thing i may ask : is there a magical trick to use to show in the table only the provious periods of the current selection.
For instance when you select Feb 2017, only January 2017 and February 2017 to be shown in the table but not March 2017 (even if there is a result for "March inventory variation")
The idea here is not to get the application polluted showing fake figures to users. For instance, for March 2017, there is no inventory value, then the inventory variation for march is obviously fake which i would like not to show to users.
Indeed, next target is to use the Inventory variation formula in other tables trying to built a complete P&L for each period
Thanks for all
Guillaume
- Mark as New
- Bookmark
- Subscribe
- Mute
- Subscribe to RSS Feed
- Permalink
- Report Inappropriate Content
So, basically see the YTD? Try this
Above(Sum({$<Mois, Année, MonthYear>}[Inventory Value])) * Avg({$<MonthYear = {"$(='>=' & Date(YearStart(Max(MonthYear)), 'MMM YYYY') & '<=' & Date(Max(MonthYear), 'MMM YYYY'))"}, Mois, Année>} 1)
- Mark as New
- Bookmark
- Subscribe
- Mute
- Subscribe to RSS Feed
- Permalink
- Report Inappropriate Content
Thanks a lot Sunny.
As always you are a big help
Guillaume
- Mark as New
- Bookmark
- Subscribe
- Mute
- Subscribe to RSS Feed
- Permalink
- Report Inappropriate Content
Sunny,
One last thing i try to show :
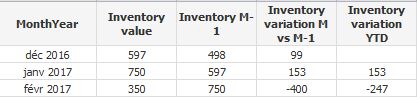
i need now to build an inventory variation YTD : meaning that it has to compare the inventory value of the current month to the inventory value of Decembre the previous year :
Any idea ?
Guillaume
- Mark as New
- Bookmark
- Subscribe
- Mute
- Subscribe to RSS Feed
- Permalink
- Report Inappropriate Content
Not sure I understand? Is the image above the output you expect to see? On what selections?
- Mark as New
- Bookmark
- Subscribe
- Mute
- Subscribe to RSS Feed
- Permalink
- Report Inappropriate Content
Yes the image is the output i am looking for with Feb 2017 as selection.
The table should show for each month of the selected year the inventory value of the current month vs the inventory value of December the previous year.
- « Previous Replies
- Next Replies »