Unlock a world of possibilities! Login now and discover the exclusive benefits awaiting you.
Announcements
ALERT: QlikView server communication interruptions following Microsoft Windows Domain Controller security updates
- Qlik Community
- :
- All Forums
- :
- QlikView
- :
- Value on data points is duplicated on each dimensi...
Options
- Subscribe to RSS Feed
- Mark Topic as New
- Mark Topic as Read
- Float this Topic for Current User
- Bookmark
- Subscribe
- Mute
- Printer Friendly Page
Turn on suggestions
Auto-suggest helps you quickly narrow down your search results by suggesting possible matches as you type.
Showing results for
Anonymous
Not applicable
2012-03-05
02:09 PM
- Mark as New
- Bookmark
- Subscribe
- Mute
- Subscribe to RSS Feed
- Permalink
- Report Inappropriate Content
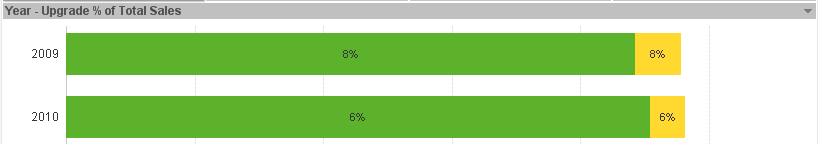
Value on data points is duplicated on each dimension
This chart has three dimensions; Upgrades, renewals and upgrade % of total sales. The upgrade % of total sales is a "value on data point". How can I show upgrade % just once, instead of on each dimension? Another thought was to change the font color to green, so that it only shows on the yellow dimensions. Couldn't figure out how to change the font color. Any suggestions would be greatly appreciated.
Thanks!
Jen
590 Views
1 Reply
Anonymous
Not applicable
2012-03-05
02:15 PM
Author
- Mark as New
- Bookmark
- Subscribe
- Mute
- Subscribe to RSS Feed
- Permalink
- Report Inappropriate Content
Correction, it has three expressions and only one dimension which is year.
321 Views