Unlock a world of possibilities! Login now and discover the exclusive benefits awaiting you.

- Qlik Community
- :
- All Forums
- :
- QlikView
- :
- Variables in a box Plot graph
- Subscribe to RSS Feed
- Mark Topic as New
- Mark Topic as Read
- Float this Topic for Current User
- Bookmark
- Subscribe
- Mute
- Printer Friendly Page

 ale_nilo84
- Mark as New
- Bookmark
- Subscribe
- Mute
- Subscribe to RSS Feed
- Permalink
- Report Inappropriate Content
Variables in a box Plot graph
Hello, I have created a box plot graph, but I have problems using variables.
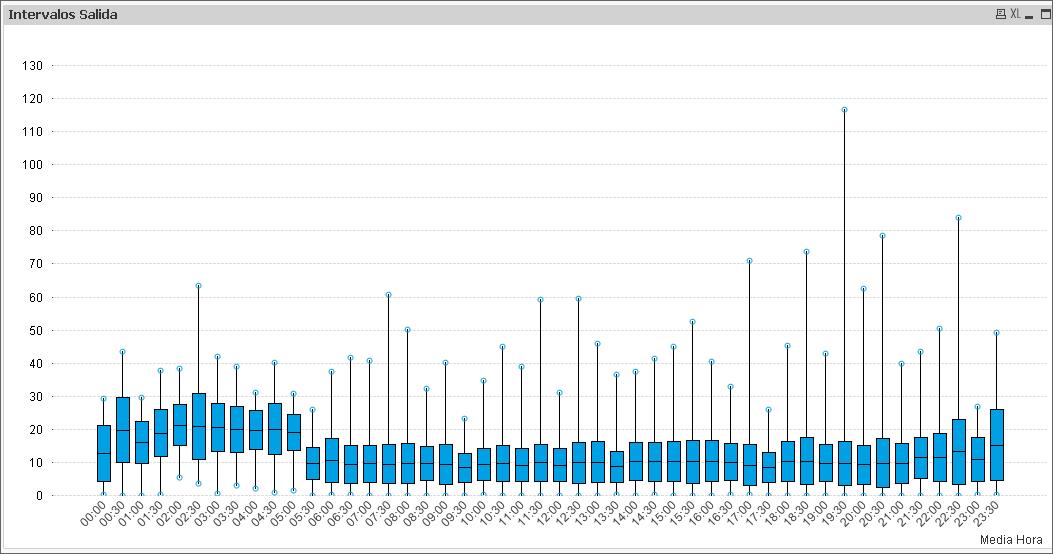
The following variable was defined: vSemanaMax = WeekName(Max(fecha_union)) to show the last week loaded
How can I insert this variable in the expressions of this chart?
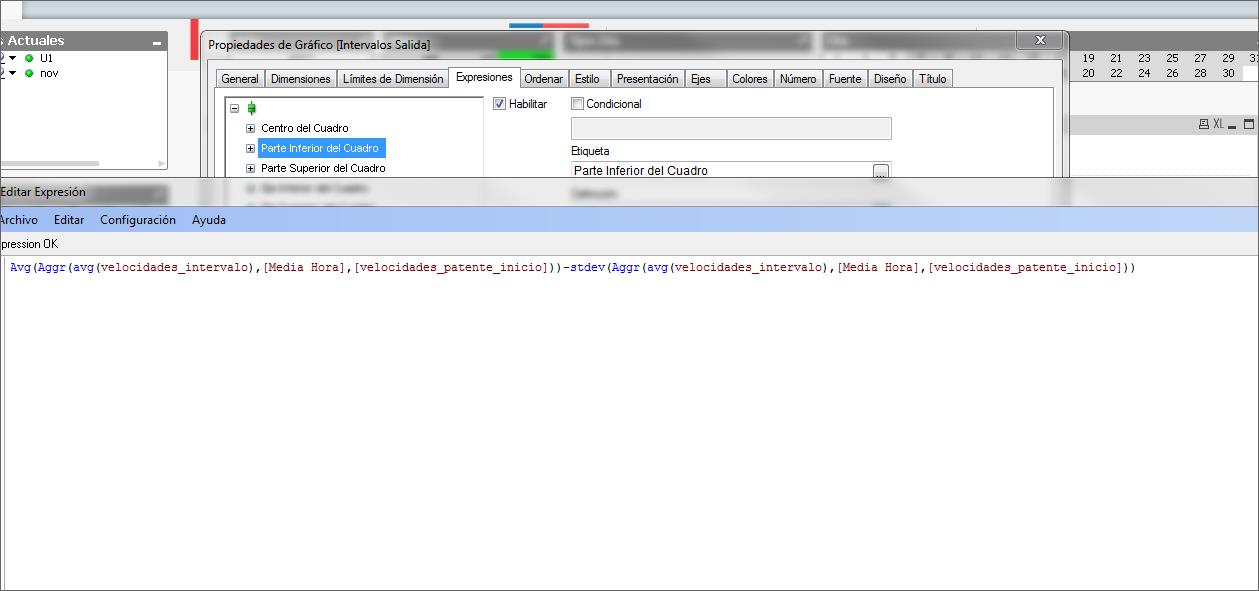
Centro del Cuadro: Avg(Aggr(avg(velocidades_intervalo),[Media Hora],[velocidades_patente_inicio]))
Parte inferior del Cuadro: Avg(Aggr(avg(velocidades_intervalo),[Media Hora],[velocidades_patente_inicio]))-stdev(Aggr(avg(velocidades_intervalo),[Media Hora],[velocidades_patente_inicio]))
Greetings from Chile


- Mark as New
- Bookmark
- Subscribe
- Mute
- Subscribe to RSS Feed
- Permalink
- Report Inappropriate Content
Perhaps this?
Centro del Cuadro: Avg(Aggr(avg({<fecha_union = {$(vSemanaMax)}>} velocidades_intervalo),[Media Hora],[velocidades_patente_inicio]))
Parte inferior del Cuadro: Avg(Aggr(avg({<fecha_union = {$(vSemanaMax)}>} velocidades_intervalo),[Media Hora],[velocidades_patente_inicio]))-stdev(Aggr(avg({<fecha_union = {$(vSemanaMax)}>} velocidades_intervalo),[Media Hora],[velocidades_patente_inicio]))
ale_nilo84
- Mark as New
- Bookmark
- Subscribe
- Mute
- Subscribe to RSS Feed
- Permalink
- Report Inappropriate Content
It doesn't work 
in the script the dates are set in this way:
fechas:
load distinct
fecha unión,
year (fecha_union) as Year,
Month(fecha_union) as Mes,
day(fecha_union) as Day,
Weekname(fecha_union) as Numero Semana,
date(fecha_union) as fecha
The expressions of the box plot graph:
Centro del Cuadro: Avg(Aggr(avg({<Numero_Semana={$(vSemanaMax)}>}velocidades_intervalo),[Media Hora],[velocidades_patente_inicio]))
Parte Inferior del Cuadro: Avg(Aggr(avg({<Numero_Semana={$(vSemanaMax)}>}velocidades_intervalo),[Media Hora],[velocidades_patente_inicio]))-stdev(Aggr(avg({<Numero_Semana={$(vSemanaMax)}>}velocidades_intervalo),[Media Hora],[velocidades_patente_inicio]))
Parte Superior del Cuadro: Avg(Aggr(avg({<Numero_Semana={$(vSemanaMax)}>}velocidades_intervalo),[Media Hora],[velocidades_patente_inicio]))+stdev(Aggr(avg({<Numero_Semana={$(vSemanaMax)}>}velocidades_intervalo),[Media Hora],[velocidades_patente_inicio]))
Eje Inferior del Cuadro: min(Aggr(avg({<Numero_Semana={$(vSemanaMax)}>}velocidades_intervalo),[Media Hora],[velocidades_patente_inicio]))
Eje Superior del Cuadro: max(Aggr(avg({<Numero_Semana={$(vSemanaMax)}>}velocidades_intervalo),[Media Hora],[velocidades_patente_inicio]))
Delimitador Inferior: min(Aggr(avg({<Numero_Semana={$(vSemanaMax)}>}velocidades_intervalo),[Media Hora],[velocidades_patente_inicio]))
Delimitador Superior: max(Aggr(avg({<Numero_Semana={$(vSemanaMax)}>}velocidades_intervalo),[Media Hora],[velocidades_patente_inicio]))
