Unlock a world of possibilities! Login now and discover the exclusive benefits awaiting you.

- Qlik Community
- :
- All Forums
- :
- QlikView
- :
- Variables in the dimension
- Subscribe to RSS Feed
- Mark Topic as New
- Mark Topic as Read
- Float this Topic for Current User
- Bookmark
- Subscribe
- Mute
- Printer Friendly Page

- Mark as New
- Bookmark
- Subscribe
- Mute
- Subscribe to RSS Feed
- Permalink
- Report Inappropriate Content
Variables in the dimension
Hi
i am having trouble in creating a chart where in the dimensions i have some banks. The peculirity is that the banks are selected through a variable.
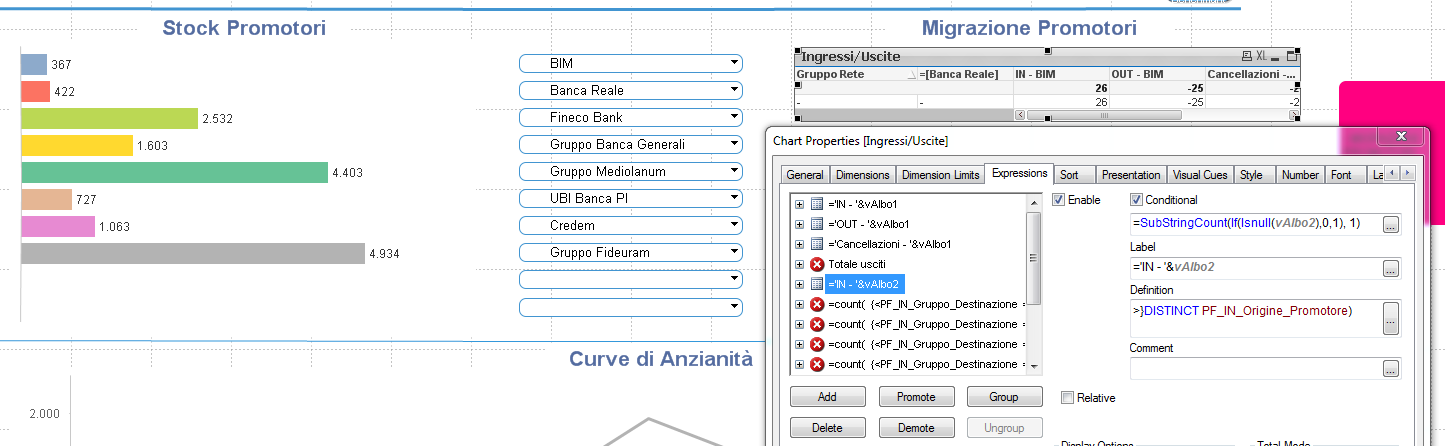
As you can see above: in the middle i select the bank that i want to analyze, and the chart on the left plots the total number of people working within that bank. (1 dimension 1 expression). What i am trying to do on the right is to have 3 expressions (new to the bank, exited the bank and cancelled) for the same banks that i select in the middle.
How can i do this?
- Mark as New
- Bookmark
- Subscribe
- Mute
- Subscribe to RSS Feed
- Permalink
- Report Inappropriate Content
So basically i have a list of banks:
| Bank Name |
|---|
| A |
| B |
| C |
| D |
| ... |
I have create 10 variables tha allow me to select from the list of banks the one i would like to analyze vAlbo1, vAlbo2 and so on.
In my new chart, i need to have in the dimensions the variables vAlbo1, vAlbo2; while in the expression i simply have some sum.
How can i do this?