Unlock a world of possibilities! Login now and discover the exclusive benefits awaiting you.

- Qlik Community
- :
- All Forums
- :
- QlikView
- :
- Re: Weekly head counts from SCD2 table
- Subscribe to RSS Feed
- Mark Topic as New
- Mark Topic as Read
- Float this Topic for Current User
- Bookmark
- Subscribe
- Mute
- Printer Friendly Page

- Mark as New
- Bookmark
- Subscribe
- Mute
- Subscribe to RSS Feed
- Permalink
- Report Inappropriate Content
Weekly head counts from SCD2 table
Hi
I have a requirement to publish monthly, weekly dashboard (kind of bar chart) from SCD type 2 table from start of year
my table is as below
| EmpID | Name | Manager | Dept | Effective_dt | Expirty_Dt | Expired_IN |
|---|---|---|---|---|---|---|
| 1 | Raju | Ramesh | Oil | 1-Jan-18 | 26-Jul-18 | Y |
| 2 | Ram | John | Oil | 1-Jan-18 | 27-Aug-18 | N |
| 3 | Ramesh | Pillai | Oil | 1-Jan-18 | 12-Dec-99 | Y |
| 1 | Raju | Pillai | Oil | 27-Jul-18 | 12-Dec-99 | N |
| 3 | Ramesh | Jacob | Oil | 28-Aug-18 | 12-Dec-99 | N |
| 4 | Jacob | Ethan | Oil | 28-Aug-18 | 12-Dec-99 | N |
I need to display a bar chart
with
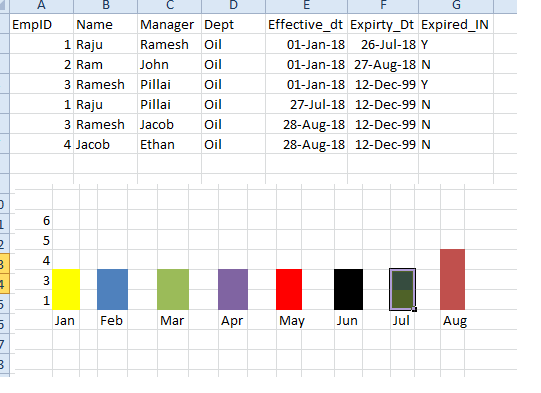
Jan -3
Feb-3
Mar-3
Apr-3
May-3
Jun-3
Jul-3
Aug-4
Any suggestions?

 arthur_dom
- Mark as New
- Bookmark
- Subscribe
- Mute
- Subscribe to RSS Feed
- Permalink
- Report Inappropriate Content
Hi Rao Kuntamukkala.
I was contacted on LinkedIn to come here and have a look in this question.
I think what you are triyng to do is something like the one that is attached. (below is a image)
If you need anything else, please contact me.
Beste regards,
Arthur
- Mark as New
- Bookmark
- Subscribe
- Mute
- Subscribe to RSS Feed
- Permalink
- Report Inappropriate Content
Thanks Arthur
Is there a way i can drill down using month filter on straight table data
Eg:
If I select month month jan - straight table should show 3 records and so on
thanks for your help
arthur_dom
- Mark as New
- Bookmark
- Subscribe
- Mute
- Subscribe to RSS Feed
- Permalink
- Report Inappropriate Content
yes... On the attached file, remove EmpId of the dimension part:


If your question is solved, please , mark as answered or helpful.
Best regards!
- Mark as New
- Bookmark
- Subscribe
- Mute
- Subscribe to RSS Feed
- Permalink
- Report Inappropriate Content
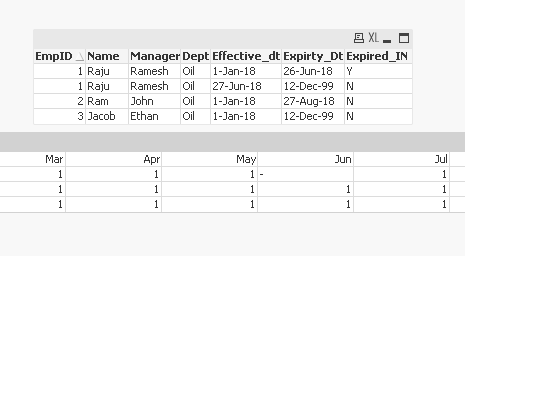
for some reason when a employee record is expired in same month and a new record is inserted with new effective date - the record is not counted in Jun month, please see below
Again, Many thanks for your help