Unlock a world of possibilities! Login now and discover the exclusive benefits awaiting you.
- Qlik Community
- :
- All Forums
- :
- QlikView
- :
- Where Clause in chart
- Subscribe to RSS Feed
- Mark Topic as New
- Mark Topic as Read
- Float this Topic for Current User
- Bookmark
- Subscribe
- Mute
- Printer Friendly Page
- Mark as New
- Bookmark
- Subscribe
- Mute
- Subscribe to RSS Feed
- Permalink
- Report Inappropriate Content
Where Clause in chart
Hi there
Could someone please help.
I have a QVD with data like...
| Cost Element | Jan Sales | Feb Sales | Project | Text |
|---|---|---|---|---|
| ABC | 1233 | 45454 | VS001 | |
| ABC | 1111 | 866 | VS001 | |
| ABC | 2234 | 454 | VS001 | |
| CCC | 222 | 77 | VS001 | |
| CCC | 4545 | 77 | VS001 |
I would like to know if I can create a chart from this QVD.
Where Cost Element=ABC then only display lines with ABC cost element
then another chart for Cost Element CCC.
Please advise.
Thanks
Accepted Solutions
- Mark as New
- Bookmark
- Subscribe
- Mute
- Subscribe to RSS Feed
- Permalink
- Report Inappropriate Content
I think you can either use a calculated dimension
=if([Cost Element]='ABC',[Cost Element])
or use set analysis in all of your chart expressions (you need an aggregation function to use set analysis in an expression).
For example, use [Cost Element] as dimension and (this will aggegate your values!):
=sum({<[Cost Element]={'ABC'}>} [Jan Sales])
The right expressions and dimensions will depend on what you want to show in the chart, of course.
Hope this helps,
Stefan
- Mark as New
- Bookmark
- Subscribe
- Mute
- Subscribe to RSS Feed
- Permalink
- Report Inappropriate Content
Hi,
Sure u can easly achieve the result using Trellis charts.
Create your chart with "Cost Element" as dimension, then use click on Trellis button and "Enable Trellis Chart". Than you can configure the number of Row and the number of Column.
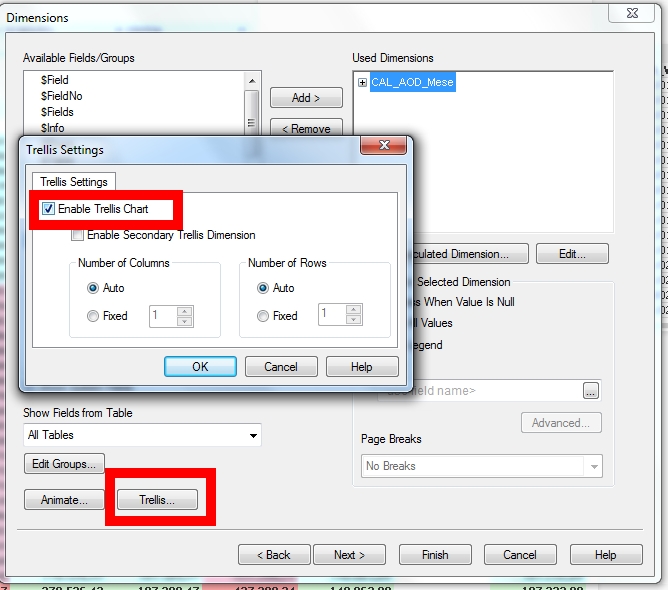
You can use other approachs (like set analysis) but the trellis chart is the most efficient to implement and dinamic (you don't have to change you document if a new cost element is added).
Hope this help.
Marco.
- Mark as New
- Bookmark
- Subscribe
- Mute
- Subscribe to RSS Feed
- Permalink
- Report Inappropriate Content
I think you can either use a calculated dimension
=if([Cost Element]='ABC',[Cost Element])
or use set analysis in all of your chart expressions (you need an aggregation function to use set analysis in an expression).
For example, use [Cost Element] as dimension and (this will aggegate your values!):
=sum({<[Cost Element]={'ABC'}>} [Jan Sales])
The right expressions and dimensions will depend on what you want to show in the chart, of course.
Hope this helps,
Stefan
- Mark as New
- Bookmark
- Subscribe
- Mute
- Subscribe to RSS Feed
- Permalink
- Report Inappropriate Content
Hi There
The calculated dimension worked and then I suppress where NULL.
Thanks! you are a star!