Unlock a world of possibilities! Login now and discover the exclusive benefits awaiting you.
- Qlik Community
- :
- All Forums
- :
- QlikView
- :
- Re: Why the legend is gray ?
- Subscribe to RSS Feed
- Mark Topic as New
- Mark Topic as Read
- Float this Topic for Current User
- Bookmark
- Subscribe
- Mute
- Printer Friendly Page
- Mark as New
- Bookmark
- Subscribe
- Mute
- Subscribe to RSS Feed
- Permalink
- Report Inappropriate Content
Why the legend is gray ?
Greetings!
This is my problem: I have a Combo Chart with quite a few expressions and dimensions. I have been using the regular color palette, however just recently I wanted to set constants colors for some of dimensions - let's say customers. Therefore I created an expression to pick RGB values for my data - and this actually worked as I wanted. What bothers me is the fact that my chart by default is being displayed with more than one expression and on this level I'm not coloring the lines by the expressions the thing is that even though the chart lines are using the default color palette - the legend is not handling this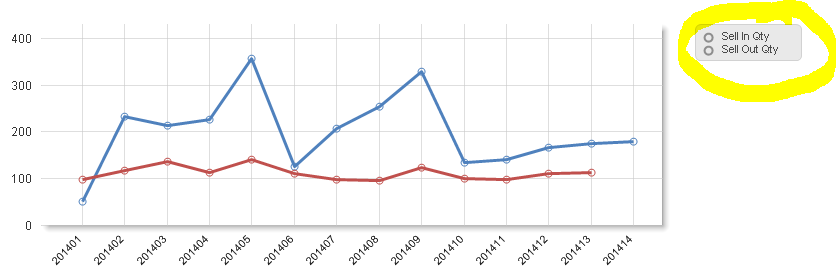
I checked that once I input in Background property of the expression any value that cannot be evaluated to valid color ( a space is best example) legend is not handling this properly, whereas the line itself picks the first color from the palette.
Any ideas / suggestions ? I have searched the community but I could not find anything similar ?
Thanks in advance for our help
Bartek
- « Previous Replies
-
- 1
- 2
- Next Replies »
- Mark as New
- Bookmark
- Subscribe
- Mute
- Subscribe to RSS Feed
- Permalink
- Report Inappropriate Content
Not sure if I fully understand what you are trying to do.
Maybe just explicitely set the color in the default path to the Expression # palette color?`
if (vProduct = 0
,if(Product = 'A'
, black()
, if(Product = 'B'
,green()
,null()
)
)
, Color(1) // resp. Color(2) for the second expression
)
- Mark as New
- Bookmark
- Subscribe
- Mute
- Subscribe to RSS Feed
- Permalink
- Report Inappropriate Content
@ swuehl - I have already thought about this way of doing that, however in real case there are around 7 expressions and what is more I have separate charts for Daily / Weekly / monthly and Quarterly views - so in total it would require a lot of changes - but still this is one of the option I still consider to implement. I still hope there is a way to accomplish this in more generic way, rather than having different expressions for coloring.
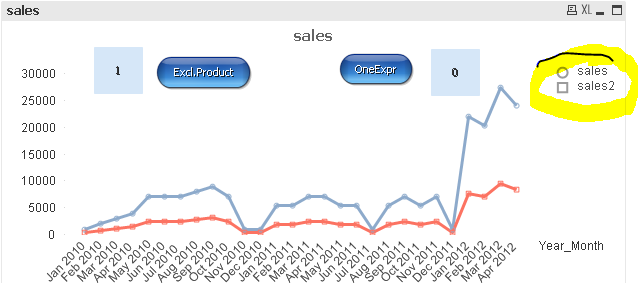
@Marcus - I reckon again there is a misunderstanding - for 2 expressions (or more) and Time as dimension (only one) I want the legend colors to be consistent with the lines colors, having also the possibility to color the lines the way i want (RGB definition for SOME of the customers / products). I know that for chart with multi lines when I have Time and Product / Customer as a dimension with a single expression works perfectly
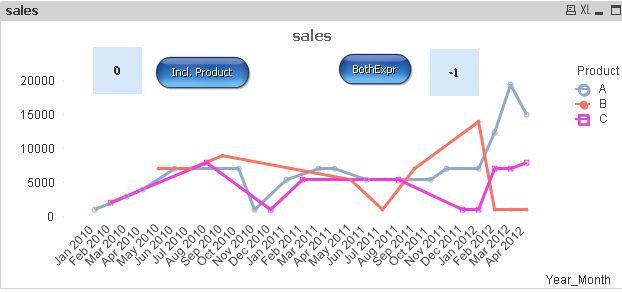
whereas multi line for >1 expression + Time as dimension - does not.
- Mark as New
- Bookmark
- Subscribe
- Mute
- Subscribe to RSS Feed
- Permalink
- Report Inappropriate Content
I think more it's a feature from the line-chart that if you used two dimensions and two expressions that only the color-defaults from chart will be applied. But if the suggestion from swuehl worked then you might to get things easier if you used a dimension-group for your various period-dimensions and maybe something like color(rowno()) to avoid hard-coding of colors.
- Marcus
- Mark as New
- Bookmark
- Subscribe
- Mute
- Subscribe to RSS Feed
- Permalink
- Report Inappropriate Content
Hi there,
We had a call with Qlik Support and it was confirmed as a BUG, waiting to be confirmed by Qlik R&D.
Thanks
Bartek
- « Previous Replies
-
- 1
- 2
- Next Replies »