Unlock a world of possibilities! Login now and discover the exclusive benefits awaiting you.

Announcements
Want to see what's currently in public preview? We've pulled it all together in one place. Check it out here
- Qlik Community
- :
- All Forums
- :
- QlikView
- :
- bar chart issue
Options
- Subscribe to RSS Feed
- Mark Topic as New
- Mark Topic as Read
- Float this Topic for Current User
- Bookmark
- Subscribe
- Mute
- Printer Friendly Page
Turn on suggestions
Auto-suggest helps you quickly narrow down your search results by suggesting possible matches as you type.
Showing results for

Not applicable
2016-02-04
08:39 AM
- Mark as New
- Bookmark
- Subscribe
- Mute
- Subscribe to RSS Feed
- Permalink
- Report Inappropriate Content
bar chart issue
Hi Experts,
I have to show the data in single bar with indicator like guage chart, if count(sales)>50 green color remaining is gray color.
i'm attaching the sample document please give me your suggestion to modify.
Regards,
Mike
651 Views
3 Replies

 vikasmahajan
MVP
2016-02-05
02:14 AM
- Mark as New
- Bookmark
- Subscribe
- Mute
- Subscribe to RSS Feed
- Permalink
- Report Inappropriate Content
Qvw is opening please create and attach again
Hope this resolve your issue.
If the issue is solved please mark the answer with Accept as Solution & like it.
If you want to go quickly, go alone. If you want to go far, go together.
If the issue is solved please mark the answer with Accept as Solution & like it.
If you want to go quickly, go alone. If you want to go far, go together.
565 Views

 its_anandrjs
Champion III
2016-02-05
02:19 AM
- Mark as New
- Bookmark
- Subscribe
- Mute
- Subscribe to RSS Feed
- Permalink
- Report Inappropriate Content
Please attached the snap shot for the requirement.
Regards
Anand
565 Views

 HirisH_V7
Master
2016-02-05
03:27 AM
- Mark as New
- Bookmark
- Subscribe
- Mute
- Subscribe to RSS Feed
- Permalink
- Report Inappropriate Content
Hi,
is this,
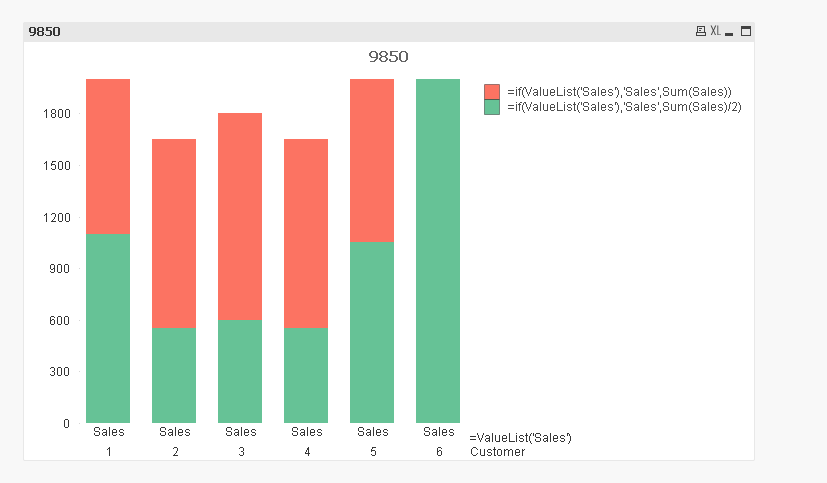
using value list,
Create a dimension: =ValueList('Sales')
Expressions: =if(ValueList('Sales'),'Sales',Sum(Sales))
=if(ValueList('Sales'),'Sales',Sum(Sales)/2)
HTH,
PFA,
Hirish
HirisH
565 Views