Unlock a world of possibilities! Login now and discover the exclusive benefits awaiting you.

- Qlik Community
- :
- All Forums
- :
- QlikView
- :
- chart choosing
- Subscribe to RSS Feed
- Mark Topic as New
- Mark Topic as Read
- Float this Topic for Current User
- Bookmark
- Subscribe
- Mute
- Printer Friendly Page

 dathathreya
- Mark as New
- Bookmark
- Subscribe
- Mute
- Subscribe to RSS Feed
- Permalink
- Report Inappropriate Content
chart choosing
Hi all,
i have 18 dimensions like
Industry agriculture,
industry retail,
industry banking,
industry logistics..etc
now i want to prepare a chart to get these data and expressions are to get sum of accounts and overdue amount.
Please help me out ..

 Digvijay_Singh
- Mark as New
- Bookmark
- Subscribe
- Mute
- Subscribe to RSS Feed
- Permalink
- Report Inappropriate Content
Pivot table is made to handle multiple dimensions and measures. So you may want to use that in your scenario.
 maxgro
- Mark as New
- Bookmark
- Subscribe
- Mute
- Subscribe to RSS Feed
- Permalink
- Report Inappropriate Content
or a table you can customize (choose dimensions and expressions)
dathathreya
- Mark as New
- Bookmark
- Subscribe
- Mute
- Subscribe to RSS Feed
- Permalink
- Report Inappropriate Content
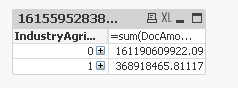
in all my 18 dimensions the values are 0 and 1 and in expression total amount has to show.when i am using pivot table it is showing like below
.
dathathreya
- Mark as New
- Bookmark
- Subscribe
- Mute
- Subscribe to RSS Feed
- Permalink
- Report Inappropriate Content
i am having only one table .so please tell me any other alternate .
Digvijay_Singh
- Mark as New
- Bookmark
- Subscribe
- Mute
- Subscribe to RSS Feed
- Permalink
- Report Inappropriate Content
Expand the '+' sign and view the whole thing, let us see how the data looks like.
