Unlock a world of possibilities! Login now and discover the exclusive benefits awaiting you.
- Qlik Community
- :
- All Forums
- :
- QlikView
- :
- chart
- Subscribe to RSS Feed
- Mark Topic as New
- Mark Topic as Read
- Float this Topic for Current User
- Bookmark
- Subscribe
- Mute
- Printer Friendly Page
- Mark as New
- Bookmark
- Subscribe
- Mute
- Subscribe to RSS Feed
- Permalink
- Report Inappropriate Content
chart
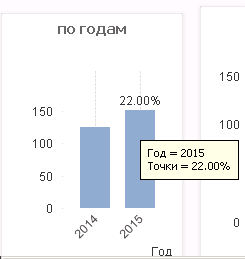
Hello! I've got a problem. Can I show difference in percentage between two or more years in a histogram?
It must look like :

for example : Sales from 2015 are more than in 2014 by 50% but sales from 2016 are lower than in 2015 by 15%.
Can I do this with out entering in script? only by adding an expression in properties of chart? Please help me.
- « Previous Replies
-
- 1
- 2
- Next Replies »
- Mark as New
- Bookmark
- Subscribe
- Mute
- Subscribe to RSS Feed
- Permalink
- Report Inappropriate Content
Super, I think that is what I need ! What I need to do for this result?
- Mark as New
- Bookmark
- Subscribe
- Mute
- Subscribe to RSS Feed
- Permalink
- Report Inappropriate Content
Please check the attached sample.
Expression used:
Dual( if(RowNo()=1, '',
Num(((sum(SUMI)-sum(SUMRETURN))-Above(sum(SUMI)-sum(SUMRETURN)))
/
Above(sum(SUMI)-sum(SUMRETURN)),'# ##0.00%')),
sum(SUMI)-sum(SUMRETURN)
)
- Mark as New
- Bookmark
- Subscribe
- Mute
- Subscribe to RSS Feed
- Permalink
- Report Inappropriate Content
Thank you so much!!!
- Mark as New
- Bookmark
- Subscribe
- Mute
- Subscribe to RSS Feed
- Permalink
- Report Inappropriate Content
There is a problem
It was so close but something need to add because I want to see number of sales not a percentage and also I need to see percentage but only above segments, what do I need to do? Help please...
- « Previous Replies
-
- 1
- 2
- Next Replies »