Unlock a world of possibilities! Login now and discover the exclusive benefits awaiting you.
- Qlik Community
- :
- All Forums
- :
- QlikView
- :
- customize behaviour of a line chart
- Subscribe to RSS Feed
- Mark Topic as New
- Mark Topic as Read
- Float this Topic for Current User
- Bookmark
- Subscribe
- Mute
- Printer Friendly Page
- Mark as New
- Bookmark
- Subscribe
- Mute
- Subscribe to RSS Feed
- Permalink
- Report Inappropriate Content
customize behaviour of a line chart
Hello
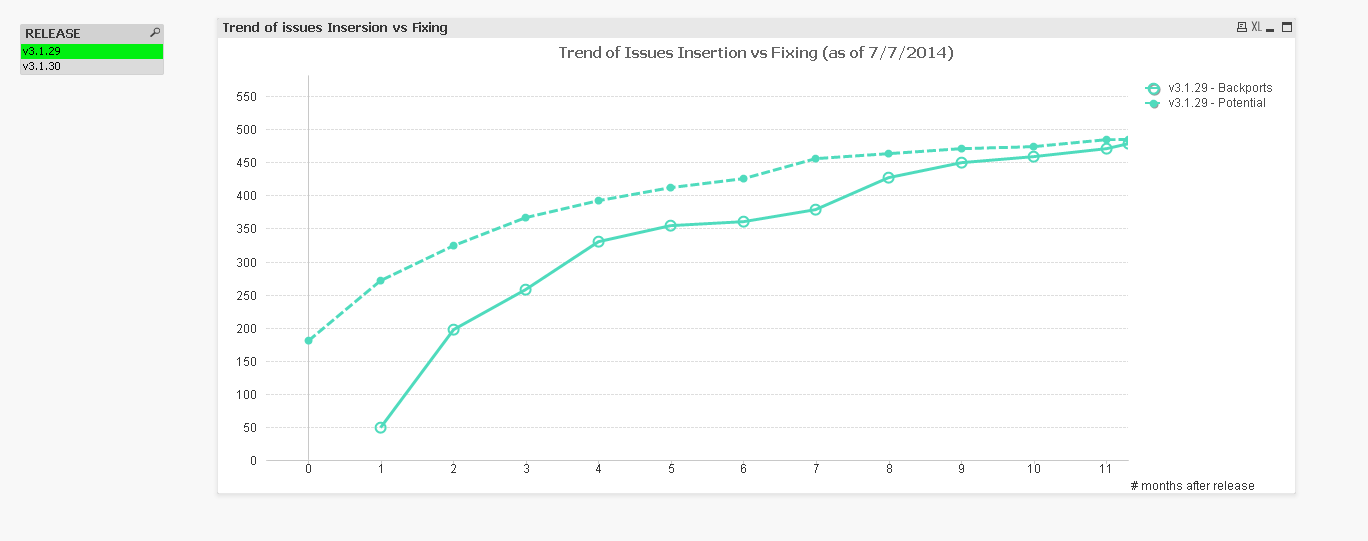
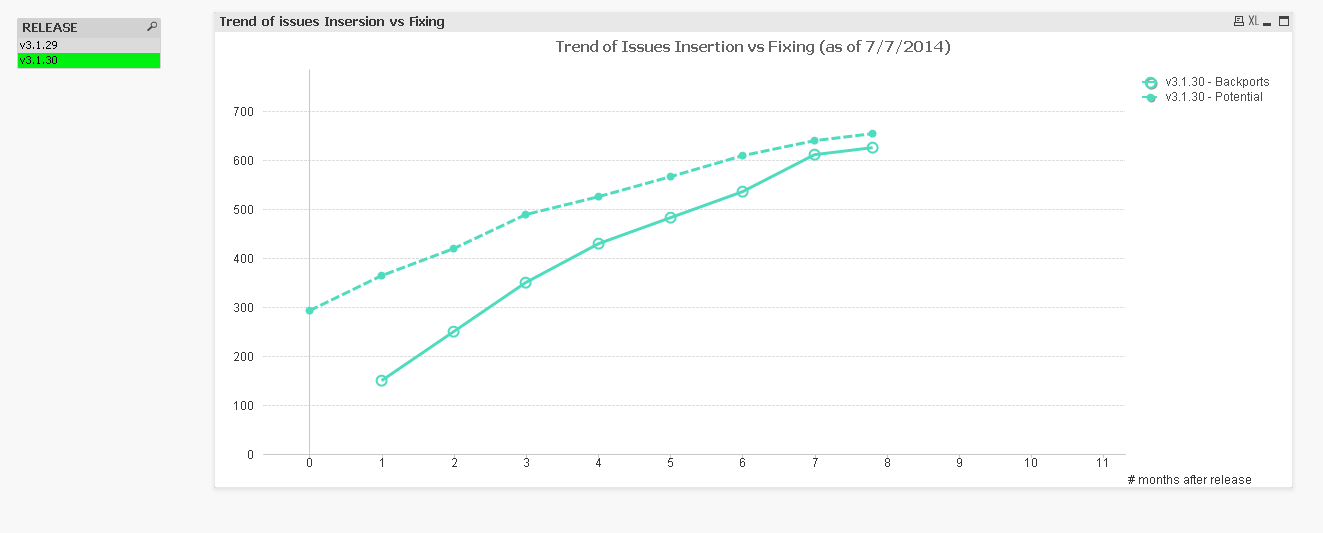
Got a line chart that is displaying on the x-axis fix period (1,2,3,4,....12)
and the dimension is the release and the line is displaying the number of defects
when I select release x the line ends at the value 7 of the x-axis
and this is true
when I select another release y; then since the line of the y release ends at 12 then the values that end at 7 will be repeated till 12
how can I force the line to stop drawing at 7 for the release x?
Please advise
- « Previous Replies
-
- 1
- 2
- Next Replies »
- Mark as New
- Bookmark
- Subscribe
- Mute
- Subscribe to RSS Feed
- Permalink
- Report Inappropriate Content
Hi Ali,
Correct me, if my assumption is right about ur requirement.
Even if u click on the values in release, the dimension should not get changed and should stick to the max value of the dimension(Say 11.3)?
Thanks,
- Mark as New
- Bookmark
- Subscribe
- Mute
- Subscribe to RSS Feed
- Permalink
- Report Inappropriate Content
yes this is true
- Mark as New
- Bookmark
- Subscribe
- Mute
- Subscribe to RSS Feed
- Permalink
- Report Inappropriate Content
Am clicking Release values over here and its not getting changed 
- Mark as New
- Bookmark
- Subscribe
- Mute
- Subscribe to RSS Feed
- Permalink
- Report Inappropriate Content
This is what u want rite?
- Mark as New
- Bookmark
- Subscribe
- Mute
- Subscribe to RSS Feed
- Permalink
- Report Inappropriate Content
yes but when you clear the selection the last value for v30 will be repeated
- « Previous Replies
-
- 1
- 2
- Next Replies »