Unlock a world of possibilities! Login now and discover the exclusive benefits awaiting you.

- Qlik Community
- :
- All Forums
- :
- QlikView
- :
- dinamic dashboard
- Subscribe to RSS Feed
- Mark Topic as New
- Mark Topic as Read
- Float this Topic for Current User
- Bookmark
- Subscribe
- Mute
- Printer Friendly Page

 warrentk80
- Mark as New
- Bookmark
- Subscribe
- Mute
- Subscribe to RSS Feed
- Permalink
- Report Inappropriate Content
dinamic dashboard
Hello to all
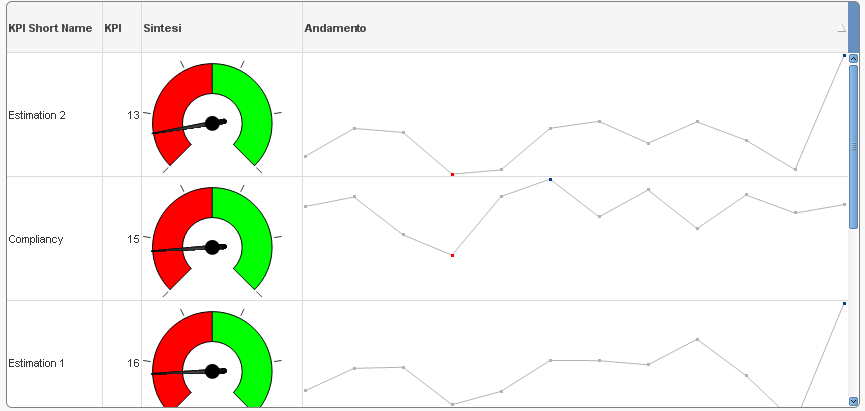
in a graph of type table, I set the table cell type dashboard.
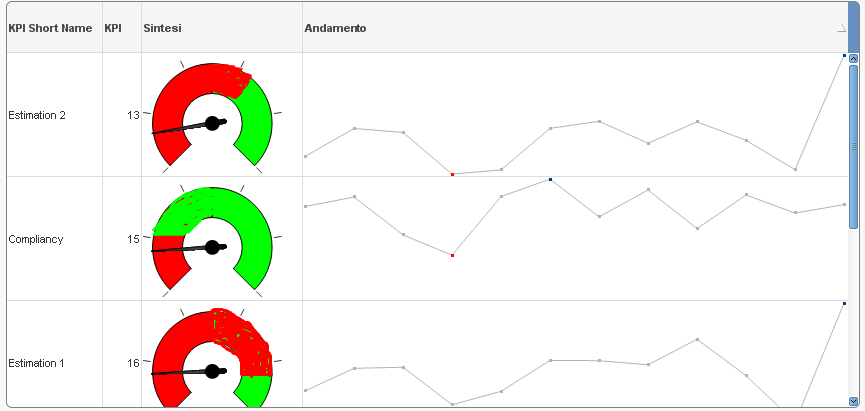
the colored bands of the dashboard, however, are fixed for all values of the table while I need to have them dynamic, based on a threshold value.
sapreppe someone show me how to do?
if I create a dashboard object I can set the width of the bands in a dynamic way, the problem is when the dashboard represent it within a cell of a chart table.
Thanks for your cooperation
Andrea
result
i want
- « Previous Replies
-
- 1
- 2
- Next Replies »

 maxgro
- Mark as New
- Bookmark
- Subscribe
- Mute
- Subscribe to RSS Feed
- Permalink
- Report Inappropriate Content
che mi risulti no; non è una questione di set analysis o variabili; è che mentre le impostazioni a livello di espressione (esempio il background color) agiscono a livello di riga/record, le impostazioni che setti dopo aver premuto il bottone Gauge Settings (min, max, colore segmenti, ....) agiscono su tutta la colonna.
Quindi possono essere dinamiche mavengono applicate a tutta la colonna.

- « Previous Replies
-
- 1
- 2
- Next Replies »