Unlock a world of possibilities! Login now and discover the exclusive benefits awaiting you.
- Qlik Community
- :
- All Forums
- :
- QlikView
- :
- fiscal year
- Subscribe to RSS Feed
- Mark Topic as New
- Mark Topic as Read
- Float this Topic for Current User
- Bookmark
- Subscribe
- Mute
- Printer Friendly Page
- Mark as New
- Bookmark
- Subscribe
- Mute
- Subscribe to RSS Feed
- Permalink
- Report Inappropriate Content
fiscal year
hello everyone
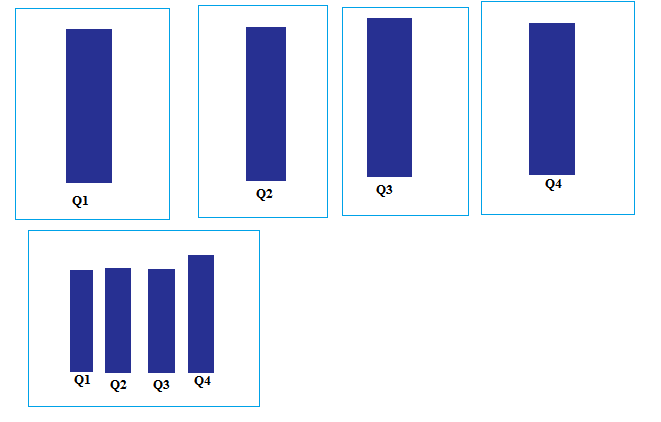
i have one requirement, i want to show Q1,Q2,Q3,Q4 in a different chart and Q1,Q2,Q3,Q4 in a single chart(fiscal year) (it means total 5 chart)
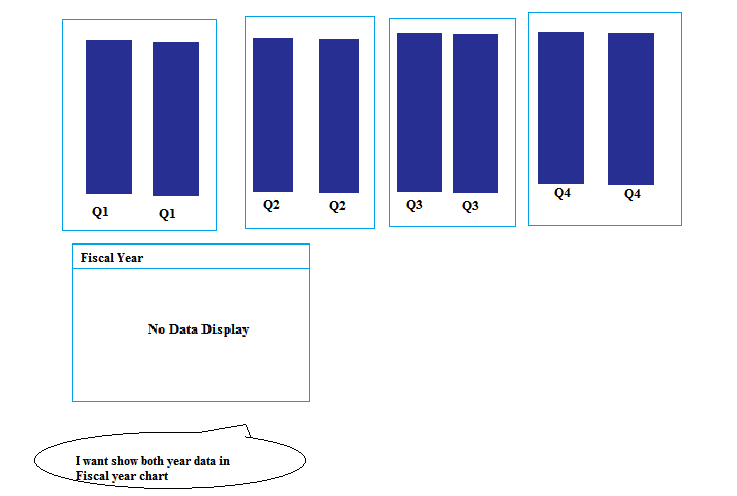
i have fiscal year from 2010 to 2015 . my issue is while i select single year then it shows in a 5 charts but when i select 2 year simultaneously then it shows 2 years data in 4 chart but not in single chart(fiscal year).
when i select single year
when i select 2 year simultaneously
Thank you.
- Mark as New
- Bookmark
- Subscribe
- Mute
- Subscribe to RSS Feed
- Permalink
- Report Inappropriate Content
Hi,
Can you please share your expressions used.
I am guessing your deimension is your Quarter field, but not knowing the set analysis used in the expression we won't be able to advise what is wrong.
Mark
- Mark as New
- Bookmark
- Subscribe
- Mute
- Subscribe to RSS Feed
- Permalink
- Report Inappropriate Content
sorry but i cant share it.
i am taking fiscal quarter as a dimension and in expression used if condition
- Mark as New
- Bookmark
- Subscribe
- Mute
- Subscribe to RSS Feed
- Permalink
- Report Inappropriate Content
Can you take Year as dimension also in the chart and check?
- Mark as New
- Bookmark
- Subscribe
- Mute
- Subscribe to RSS Feed
- Permalink
- Report Inappropriate Content
If you can't share your calculation then i won't be able to tell you what is wrong with it.
I am not asking for any data, just evening if you change the field names so we can see the syntax.
Something like
IF(Value =1,SUM(Amount))
Mark
- Mark as New
- Bookmark
- Subscribe
- Mute
- Subscribe to RSS Feed
- Permalink
- Report Inappropriate Content
but it show data only for 1st year
- Mark as New
- Bookmark
- Subscribe
- Mute
- Subscribe to RSS Feed
- Permalink
- Report Inappropriate Content
In both the charts your using the same Fiscal Quarter?? or calendar Quarter quater in one chart ??
- Mark as New
- Bookmark
- Subscribe
- Mute
- Subscribe to RSS Feed
- Permalink
- Report Inappropriate Content
whats the expression for both the charts ?? same or different