Unlock a world of possibilities! Login now and discover the exclusive benefits awaiting you.

- Qlik Community
- :
- All Forums
- :
- QlikView
- :
- help in expression
- Subscribe to RSS Feed
- Mark Topic as New
- Mark Topic as Read
- Float this Topic for Current User
- Bookmark
- Subscribe
- Mute
- Printer Friendly Page

 ali_hijazi
- Mark as New
- Bookmark
- Subscribe
- Mute
- Subscribe to RSS Feed
- Permalink
- Report Inappropriate Content
help in expression
got a pivot table with Month as Dimension
my expression is simple sum(Sales)
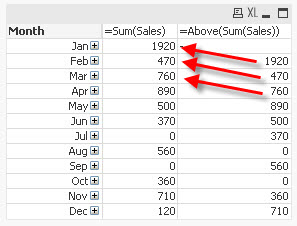
however for each month I want to display a value representing the sales for previous month
Message was edited by: Ali Hijazi

- « Previous Replies
-
- 1
- 2
- Next Replies »
 Gysbert_Wassena
- Mark as New
- Bookmark
- Subscribe
- Mute
- Subscribe to RSS Feed
- Permalink
- Report Inappropriate Content
Then create an AsOf table with those values. The concept will be the same. Good luck.
talk is cheap, supply exceeds demand

 MarcoWedel
- Mark as New
- Bookmark
- Subscribe
- Mute
- Subscribe to RSS Feed
- Permalink
- Report Inappropriate Content
Hi,
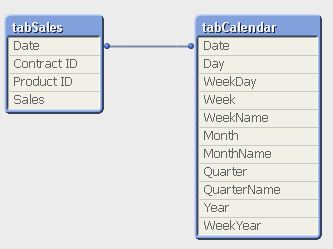
one solution could be:

tabSales:
LOAD *
FROM [http://community.qlik.com/servlet/JiveServlet/download/654995-137136/13MonthsTrend.xlsx] (ooxml, embedded labels, table is Sheet1);

tabCalendar:
LOAD *,
    Day(Date) as Day,
    WeekDay(Date) as WeekDay,
    Week(Date) as Week,
    WeekName(Date) as WeekName,
    Month(Date) as Month,
    MonthName(Date) as MonthName,
    Ceil(Month(Date)/3) as Quarter,
    QuarterName(Date) as QuarterName,
    Year(Date) as Year,
    WeekYear(Date) as WeekYear;
LOAD Date(MakeDate(2009)+IterNo()-1) as Date
AutoGenerate 1
While MakeDate(2009)+IterNo()-1<=Today();
hope this helps
regards
Marco

- « Previous Replies
-
- 1
- 2
- Next Replies »