Unlock a world of possibilities! Login now and discover the exclusive benefits awaiting you.

- Qlik Community
- :
- All Forums
- :
- QlikView
- :
- how to make this chart...
Options
- Subscribe to RSS Feed
- Mark Topic as New
- Mark Topic as Read
- Float this Topic for Current User
- Bookmark
- Subscribe
- Mute
- Printer Friendly Page
Turn on suggestions
Auto-suggest helps you quickly narrow down your search results by suggesting possible matches as you type.
Showing results for

Anonymous
Not applicable
2012-10-09
09:08 AM
- Mark as New
- Bookmark
- Subscribe
- Mute
- Subscribe to RSS Feed
- Permalink
- Report Inappropriate Content
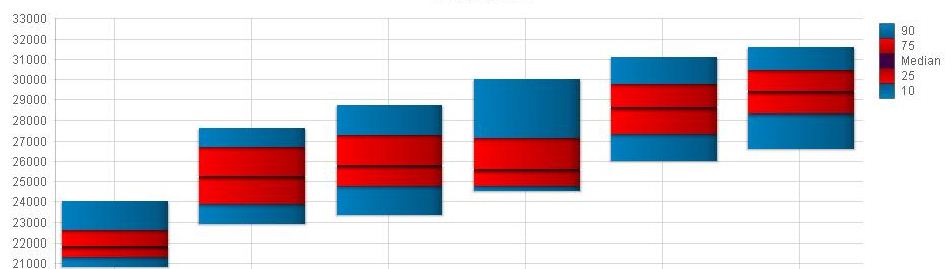
how to make this chart...
Hi,
How do i achive this? i only manage to get the intervall between P10 and P90 floating, but how do i get the bars inbetween?
Thanks in advance.
//A.
742 Views
2 Replies

 christophebraul
Specialist
2012-10-09
09:24 AM
- Mark as New
- Bookmark
- Subscribe
- Mute
- Subscribe to RSS Feed
- Permalink
- Report Inappropriate Content
Hi,
I think its a Box & Whiskers Plot representation. You can use this in the combo chart type.
Can you share an example of your dataset ?
642 Views

 jagan
jagan
Partner - Champion III
2012-10-09
11:29 AM
- Mark as New
- Bookmark
- Subscribe
- Mute
- Subscribe to RSS Feed
- Permalink
- Report Inappropriate Content
Hi,
Check this attachment hope it helps you.
Regards,
Jagan.
641 Views