Unlock a world of possibilities! Login now and discover the exclusive benefits awaiting you.
Announcements
ALERT: QlikView server communication interruptions following Microsoft Windows Domain Controller security updates
- Qlik Community
- :
- All Forums
- :
- QlikView
- :
- Re: legend in a bar chart
Options
- Subscribe to RSS Feed
- Mark Topic as New
- Mark Topic as Read
- Float this Topic for Current User
- Bookmark
- Subscribe
- Mute
- Printer Friendly Page
Turn on suggestions
Auto-suggest helps you quickly narrow down your search results by suggesting possible matches as you type.
Showing results for
Not applicable
2016-03-01
06:03 AM
- Mark as New
- Bookmark
- Subscribe
- Mute
- Subscribe to RSS Feed
- Permalink
- Report Inappropriate Content
legend in a bar chart
Hi,
It is possible to show numbers in legend on a pie chart - see option below.
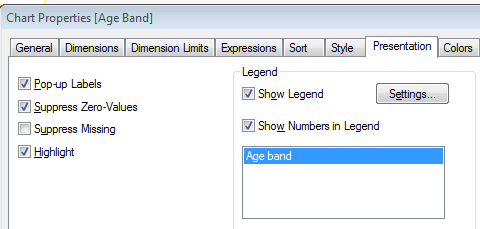
However, this option does not seem to be possible on a bar chart (same tick box isn't there). Is it possible to add this on?
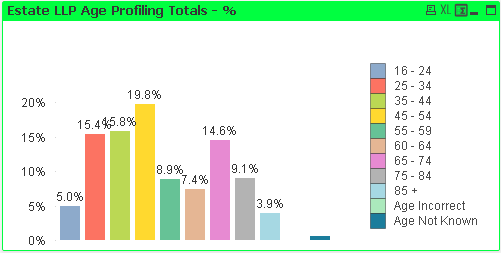
You will see the cahrt we have - where the legend is instead of 16-24, 25-35 we ideally wnat the colours to show but then show the numbers (e.g 50, 100 etc). Is this possible?
Chris
- Tags:
- new_to_qlikview
3,817 Views
- « Previous Replies
- Next Replies »
22 Replies
Not applicable
2016-03-01
07:53 AM
Author
- Mark as New
- Bookmark
- Subscribe
- Mute
- Subscribe to RSS Feed
- Permalink
- Report Inappropriate Content
Hi,
Yes that's why I have been trying but its really fidgety!
Will only show one figure:
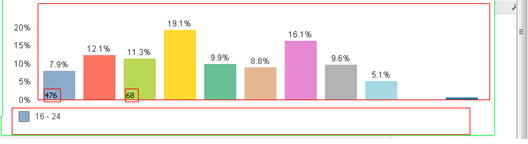
569 Views
Partner Ambassador/MVP
2016-03-01
08:44 AM
- Mark as New
- Bookmark
- Subscribe
- Mute
- Subscribe to RSS Feed
- Permalink
- Report Inappropriate Content
Partner Ambassador/MVP
2016-03-01
08:52 AM
- Mark as New
- Bookmark
- Subscribe
- Mute
- Subscribe to RSS Feed
- Permalink
- Report Inappropriate Content
Create your Dimension as a calculated Dim like:
=aggr(
num(Sum(LineSalesAmount),'$#,##0')
,AgeBand)
-Rob
- « Previous Replies
- Next Replies »