Unlock a world of possibilities! Login now and discover the exclusive benefits awaiting you.

- Qlik Community
- :
- All Forums
- :
- QlikView
- :
- predict annualized turnover
- Subscribe to RSS Feed
- Mark Topic as New
- Mark Topic as Read
- Float this Topic for Current User
- Bookmark
- Subscribe
- Mute
- Printer Friendly Page

 Margaret
- Mark as New
- Bookmark
- Subscribe
- Mute
- Subscribe to RSS Feed
- Permalink
- Report Inappropriate Content
predict annualized turnover
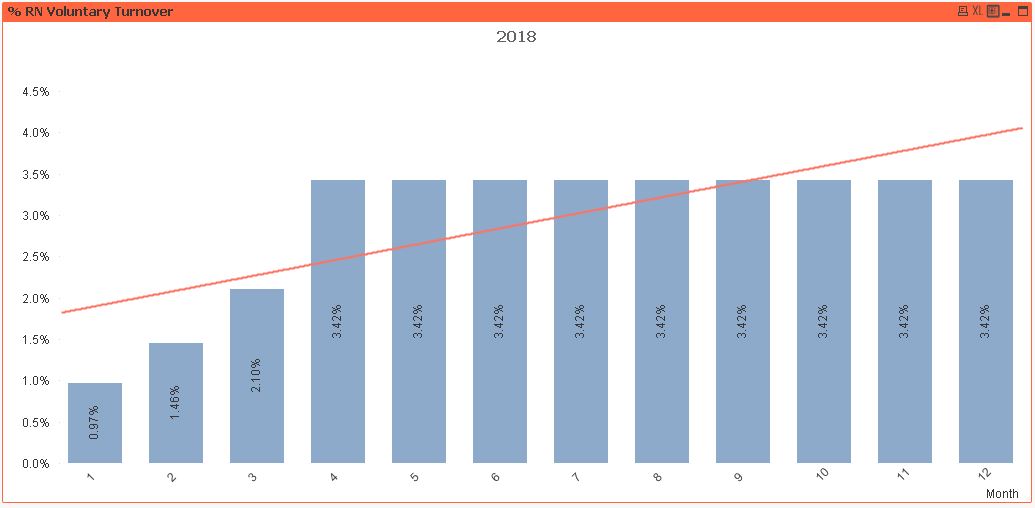
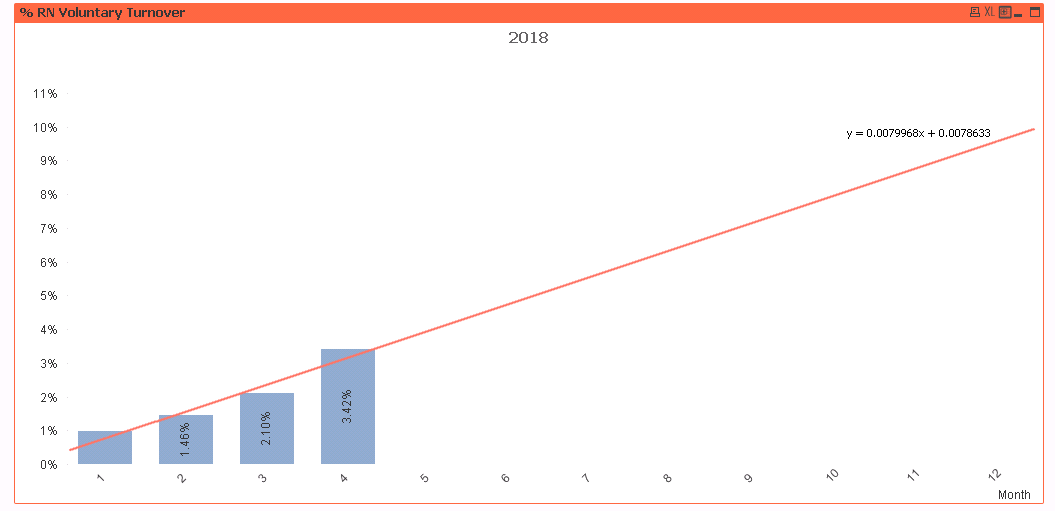
I created a bar graph depicting accumulated % Employee (in this case, Registered Nurses (RN's)) Turnover for this year. I want to predict it for the rest of the year. I've added values for the rest of the months of this year and a Trendline that works as a prediction (I think?). But I don't want any bars corresponding to those months (because we don't know the actual Turnover for those months yet) i.e., I want the bars for months 5-12 here (and the % values on them), to disappear--and I don't want those values effecting the Trendline. I want the Trendline extend into the future based on the months that I have real data for. I've also attached a qvw. How can I do this?
Accepted Solutions

 sunny_talwar
- Mark as New
- Bookmark
- Subscribe
- Mute
- Subscribe to RSS Feed
- Permalink
- Report Inappropriate Content
sunny_talwar
- Mark as New
- Bookmark
- Subscribe
- Mute
- Subscribe to RSS Feed
- Permalink
- Report Inappropriate Content
Is this what you want?
Margaret
- Mark as New
- Bookmark
- Subscribe
- Mute
- Subscribe to RSS Feed
- Permalink
- Report Inappropriate Content
Yes. You are my hero!
