Unlock a world of possibilities! Login now and discover the exclusive benefits awaiting you.

- Qlik Community
- :
- All Forums
- :
- QlikView
- :
- Re: show datavalues upto today
- Subscribe to RSS Feed
- Mark Topic as New
- Mark Topic as Read
- Float this Topic for Current User
- Bookmark
- Subscribe
- Mute
- Printer Friendly Page

- Mark as New
- Bookmark
- Subscribe
- Mute
- Subscribe to RSS Feed
- Permalink
- Report Inappropriate Content
show datavalues upto today
i have date field and Actual values
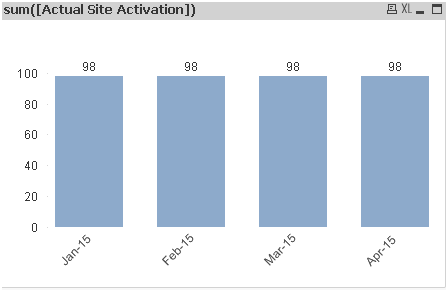
here i want to show only data Upto Today() means Feb-15. Cutoff the values after feb-2015.
how to write this in set analysis
i need this in front end only
Thanks,
- « Previous Replies
-
- 1
- 2
- Next Replies »
- Mark as New
- Bookmark
- Subscribe
- Mute
- Subscribe to RSS Feed
- Permalink
- Report Inappropriate Content
Hi Massimo,
still no luck,,
Please find the above Sample application
Thanks for your time

 maxgro
- Mark as New
- Bookmark
- Subscribe
- Mute
- Subscribe to RSS Feed
- Permalink
- Report Inappropriate Content
replace the values in Date field with date
example
load * inline [
Date, Actual Site Activation
3/15/2015,10
2/15/2015,20
1/15/2015,2
4/15/2015,30
];
in chart
=Sum({$<Date = {"<=$(=(MonthEnd(Today())))"}>} [Actual Site Activation])

 its_anandrjs
- Mark as New
- Bookmark
- Subscribe
- Mute
- Subscribe to RSS Feed
- Permalink
- Report Inappropriate Content
Hi,
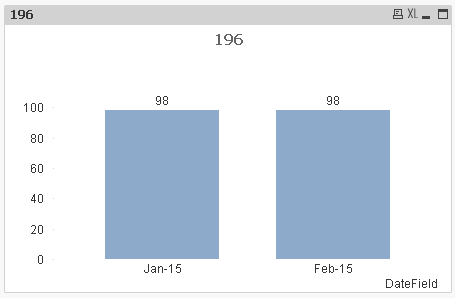
It is better you use date format in the script and then use in the chart
Ex:-
T1:
LOAD Date,
[Actual Site Activation]
FROM
j1.xlsx.xls
(biff, embedded labels, table is Sheet1$);
NoConcatenate
LOAD
Date(date#(Date,'MMM-YY'),'MMM-YY') as DateField,
[Actual Site Activation]
Resident T1;
DROP Table T1;
And in charts
Dim:- DateField
Expre:- =Sum({$<DateField = {'<=$(=(Date(MonthName(Today()),'MMM-YY')))'}>} [Actual Site Activation])
Regards,
Anand
- Mark as New
- Bookmark
- Subscribe
- Mute
- Subscribe to RSS Feed
- Permalink
- Report Inappropriate Content
Hi,
I have attached a qvw file for you in previous post and that is working fine
- « Previous Replies
-
- 1
- 2
- Next Replies »