Unlock a world of possibilities! Login now and discover the exclusive benefits awaiting you.

Announcements
Want to see what's currently in public preview? We've pulled it all together in one place. Check it out here
- Qlik Community
- :
- All Forums
- :
- QlikView
- :
- specific pivot feature
Options
- Subscribe to RSS Feed
- Mark Topic as New
- Mark Topic as Read
- Float this Topic for Current User
- Bookmark
- Subscribe
- Mute
- Printer Friendly Page
Turn on suggestions
Auto-suggest helps you quickly narrow down your search results by suggesting possible matches as you type.
Showing results for

Anonymous
Not applicable
2013-12-18
05:54 AM
- Mark as New
- Bookmark
- Subscribe
- Mute
- Subscribe to RSS Feed
- Permalink
- Report Inappropriate Content
specific pivot feature
hello everybody.
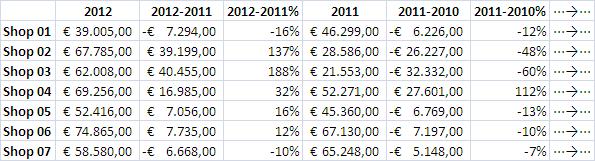
i have this data set: shops and their sales per year. i'd like to create a pivot chart showing the sales per shop/year AND the differences (absolute and percent) between consecutive years. see the followng image: image (Excel example):
thanx
2,215 Views
- « Previous Replies
-
- 1
- 2
- Next Replies »
10 Replies
Anonymous
Not applicable
2014-01-08
03:18 AM
Author
- Mark as New
- Bookmark
- Subscribe
- Mute
- Subscribe to RSS Feed
- Permalink
- Report Inappropriate Content
that's it! do you think it could be possible to set it iterative? i.e.:
- let's assume today is 7/1/2022 (the 7th of January year 2022);
- the date of the first record is 4/5/2011 (the 4th of May 2011)
- we have 2022-2011+1 = 12 years passing through
- instead of writing sum({<year = {$(=max(year)-2)}>}sales) ... could Qlik manage something iterative to create expressions automatically for each year recorded?.
thanx, bye
314 Views
- « Previous Replies
-
- 1
- 2
- Next Replies »