Unlock a world of possibilities! Login now and discover the exclusive benefits awaiting you.

Announcements
Q&A with Qlik - Qlik Cloud Migration: Questions about migrating to Qlik Cloud? Catch the latest replay!
- Qlik Community
- :
- All Forums
- :
- QlikView
- :
- stock loss chart in qlikview
Options
- Subscribe to RSS Feed
- Mark Topic as New
- Mark Topic as Read
- Float this Topic for Current User
- Bookmark
- Subscribe
- Mute
- Printer Friendly Page
Turn on suggestions
Auto-suggest helps you quickly narrow down your search results by suggesting possible matches as you type.
Showing results for

Not applicable
2015-04-23
05:00 AM
- Mark as New
- Bookmark
- Subscribe
- Mute
- Subscribe to RSS Feed
- Permalink
- Report Inappropriate Content
stock loss chart in qlikview
hello all,
please how do I create stock loss chart in qlikview to show different color for stock loss and gains?
- Tags:
- new_to_qlikview
878 Views
6 Replies
Not applicable
2015-04-23
05:09 AM
Author
- Mark as New
- Bookmark
- Subscribe
- Mute
- Subscribe to RSS Feed
- Permalink
- Report Inappropriate Content
Hi Damilola,
Can you upload sample data?
Priyantha.
750 Views

 rajeshvaswani77
Specialist III
2015-04-23
05:12 AM
- Mark as New
- Bookmark
- Subscribe
- Mute
- Subscribe to RSS Feed
- Permalink
- Report Inappropriate Content
Hi,
You can use a bar chart, the negative bars below the axis can show loss and positive bars above the axis can show gains.
thanks,
Rajesh Vaswani
750 Views
Not applicable
2015-04-23
05:16 AM
Author
- Mark as New
- Bookmark
- Subscribe
- Mute
- Subscribe to RSS Feed
- Permalink
- Report Inappropriate Content

here is the sample
750 Views
rajeshvaswani77
Specialist III
2015-04-23
05:19 AM
- Mark as New
- Bookmark
- Subscribe
- Mute
- Subscribe to RSS Feed
- Permalink
- Report Inappropriate Content
As per this sample, you will have to use Combo Chart to achieve this.
thanks,
Rajesh Vaswani
750 Views

 buzzy996
Master II
2015-04-23
05:23 AM
- Mark as New
- Bookmark
- Subscribe
- Mute
- Subscribe to RSS Feed
- Permalink
- Report Inappropriate Content
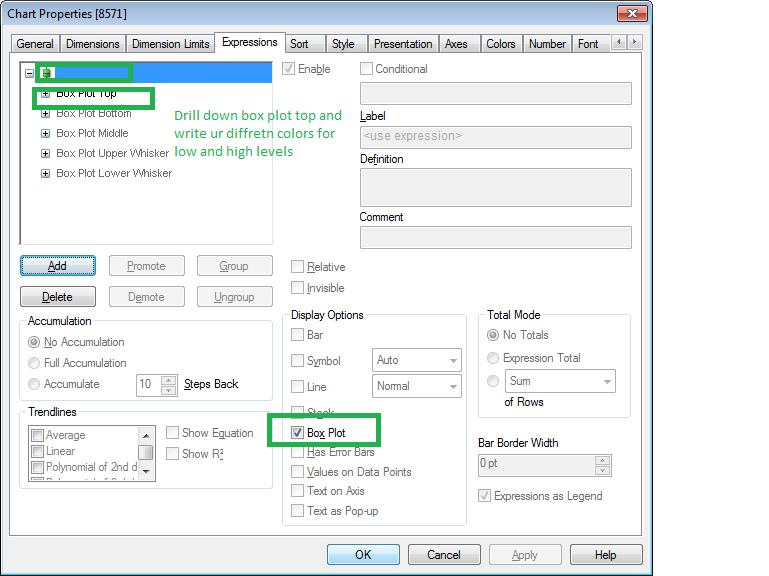
i think u have to use combo chart with box plot,like below..
750 Views
Not applicable
2015-04-23
05:44 AM
Author
- Mark as New
- Bookmark
- Subscribe
- Mute
- Subscribe to RSS Feed
- Permalink
- Report Inappropriate Content
thanks, I later used "bar offset" under bar chart in Expression and Line format to create 2 different bar and line charts.
Thanks everyone