Unlock a world of possibilities! Login now and discover the exclusive benefits awaiting you.
Announcements
Talend Cloud AWS EU Scheduled Outage: Starting Tues 26 May 21:00 CEST with expected completion Wed 27 May 01:00 CEST
- Qlik Community
- :
- Forums
- :
- Analytics & AI
- :
- Products & Topics
- :
- Visualization and Usability
- :
- Combine the two line graphs in single one
Options
- Subscribe to RSS Feed
- Mark Topic as New
- Mark Topic as Read
- Float this Topic for Current User
- Bookmark
- Subscribe
- Mute
- Printer Friendly Page
Turn on suggestions
Auto-suggest helps you quickly narrow down your search results by suggesting possible matches as you type.
Showing results for
Anonymous
Not applicable
2017-03-01
06:42 AM
- Mark as New
- Bookmark
- Subscribe
- Mute
- Subscribe to RSS Feed
- Permalink
- Report Inappropriate Content
Combine the two line graphs in single one
Hello All,
Attached image is screenshot which contains two graphs "Number of Defects Closed Per Month" and "Number of Defects opened Per Month". For both graphs measure is DefectId and dimensions are according for defects closed and defects opened which are at left side of graph.
I want to create the signle graph which will show the dimensions with separate lines and with signle measure as defectid.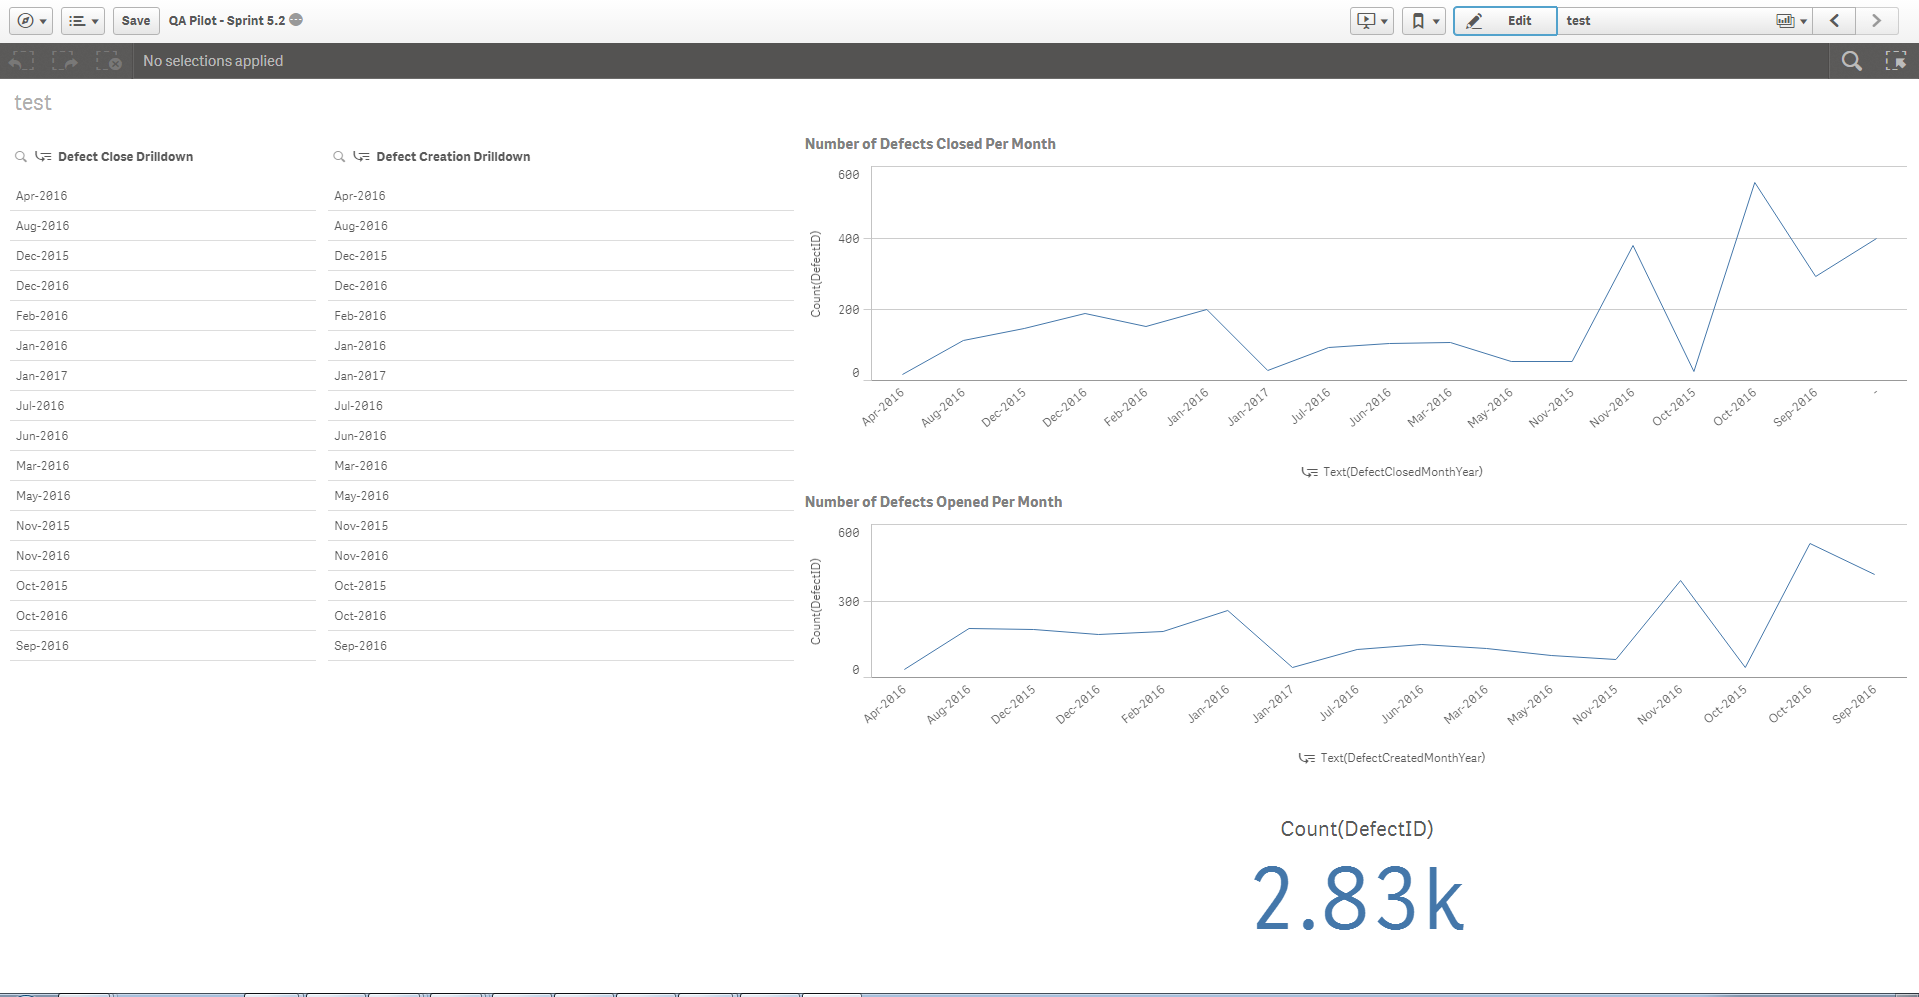
817 Views
1 Reply
MVP
2017-03-01
06:45 AM
- Mark as New
- Bookmark
- Subscribe
- Mute
- Subscribe to RSS Feed
- Permalink
- Report Inappropriate Content
You will need to create a Canonical Date to be able to accomplish this
754 Views