Unlock a world of possibilities! Login now and discover the exclusive benefits awaiting you.
Announcements
Talend Cloud AWS EU Scheduled Outage: Starting Tues 26 May 21:00 CEST with expected completion Wed 27 May 01:00 CEST
- Qlik Community
- :
- Forums
- :
- Analytics & AI
- :
- Products & Topics
- :
- Visualization and Usability
- :
- Cross Table - Date Logic
Options
- Subscribe to RSS Feed
- Mark Topic as New
- Mark Topic as Read
- Float this Topic for Current User
- Bookmark
- Subscribe
- Mute
- Printer Friendly Page
Turn on suggestions
Auto-suggest helps you quickly narrow down your search results by suggesting possible matches as you type.
Showing results for
Creator III
2017-09-06
04:16 AM
- Mark as New
- Bookmark
- Subscribe
- Mute
- Subscribe to RSS Feed
- Permalink
- Report Inappropriate Content
Cross Table - Date Logic
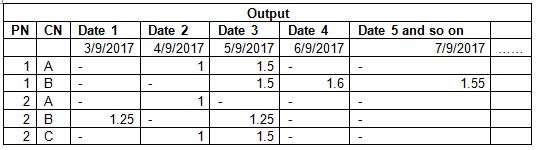
I have data with several dates and want to show like below.
Sample input data and output given below
Input :
PN | CN | Date | Value |
1 | A | 4/9/2017 | 1 |
1 | A | 5/9/2017 |
|
1 | B | 5/9/2017 |
|
1 | B | 6/9/2017 |
|
1 | B | 7/9/2017 |
|
2 | A | 4/9/2017 | 1 |
2 | B | 3/9/2017 |
|
2 | B | 5/9/2017 |
|
2 | C | 4/9/2017 | 1 |
2 | C | 5/9/2017 |
|
Should be like :
1,100 Views
3 Replies
Champion III
2017-09-06
04:20 AM
- Mark as New
- Bookmark
- Subscribe
- Mute
- Subscribe to RSS Feed
- Permalink
- Report Inappropriate Content
just Pivot the Date field in a Pivot Table or Look at Generic Load
Vineeth Pujari
If a post helps to resolve your issue, please accept it as a Solution.
If a post helps to resolve your issue, please accept it as a Solution.
1,002 Views
Master
2017-09-06
04:37 AM
- Mark as New
- Bookmark
- Subscribe
- Mute
- Subscribe to RSS Feed
- Permalink
- Report Inappropriate Content
1,002 Views
Partner - Champion III
2017-09-06
05:14 AM
- Mark as New
- Bookmark
- Subscribe
- Mute
- Subscribe to RSS Feed
- Permalink
- Report Inappropriate Content
Hi,
Try like this
Data:
LOAD
*,
'Date' & AutoNumber(YourDateFieldName) AS DateNumber
FROM DataSource;
Now use Pivot table, drag DateNumber and your date field to top then you can get the similar layout.
Regards,
Jagan.
1,002 Views