Unlock a world of possibilities! Login now and discover the exclusive benefits awaiting you.

- Qlik Community
- :
- Forums
- :
- Analytics & AI
- :
- Products & Topics
- :
- Visualization and Usability
- :
- How to Calculate New Hire vs Terminated Employees
- Subscribe to RSS Feed
- Mark Topic as New
- Mark Topic as Read
- Float this Topic for Current User
- Bookmark
- Subscribe
- Mute
- Printer Friendly Page

 Shahzad_Ahsan
- Mark as New
- Bookmark
- Subscribe
- Mute
- Subscribe to RSS Feed
- Permalink
- Report Inappropriate Content
How to Calculate New Hire vs Terminated Employees
Hi Everyone
I need something like this in qlik sense.
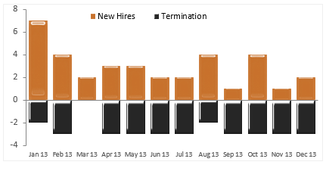
I have managed to do something near to it but not the exact result
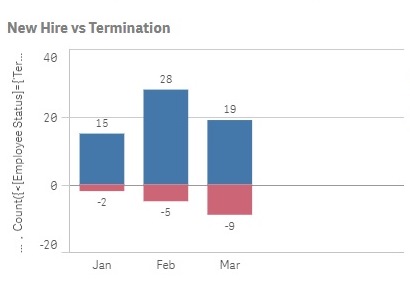
New hire is coming correct but Terminated employees are not right.
Problem: I have Hire Date and Terminated Date. So how can I use the dimension.
If I use Hire Date as dimension. then Hired Employee result comes correct. If I use Terminated Date as dimension then Terminated employee result comes correct. How to show both at the same time??
Measure 1 : Count({<[Employee Status]={'Current Employees'},[Hire Year]={"$(=(Max([Hire Year])))"}>} [Employee Number])
Measure 2 : Count({<[Employee Status]={'Terminated Employees'},[Contract End Year]={"$(=(Max([Hire Year])))"}>} [Employee Number])*-1
Thank You

 sunny_talwar
- Mark as New
- Bookmark
- Subscribe
- Mute
- Subscribe to RSS Feed
- Permalink
- Report Inappropriate Content
Do you may be need this?
Count({<[Employee Status] = {'Terminated Employees'}, [Contract End Year] = {"$(=(Max([Contract End Year])))"}>} [Employee Number]) * -1
Shahzad_Ahsan
- Mark as New
- Bookmark
- Subscribe
- Mute
- Subscribe to RSS Feed
- Permalink
- Report Inappropriate Content
Hi Sunny
Thank You for your reply
But this is not working. By using this, the negative value does not appear.
sunny_talwar
- Mark as New
- Bookmark
- Subscribe
- Mute
- Subscribe to RSS Feed
- Permalink
- Report Inappropriate Content
Would you be able to share a sample to look at this?
Shahzad_Ahsan
- Mark as New
- Bookmark
- Subscribe
- Mute
- Subscribe to RSS Feed
- Permalink
- Report Inappropriate Content
Previously I was using separate bar charts for Hired and Terminated . But I want to manage it in one bar chart.
Pic 1: Hired
Dimension : [Hire Month]
Measure: Count({<[Employee Status]={'Current Employees'},[Hire Year]={"$(=(Max([Hire Year])))"}>} [Employee Number])
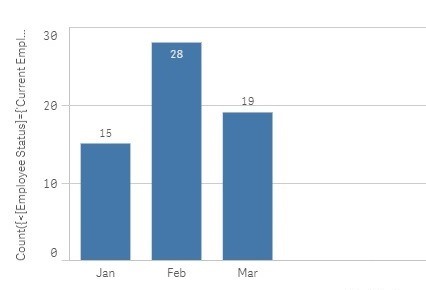
Pic 2: Terminated
Dimension: [Contract End Month]
Measure: Count({<[Employee Status] = {'Terminated Employees'}, [Contract End Year] = {"$(=(Max([Hire Year])))"}>} [Employee Number])
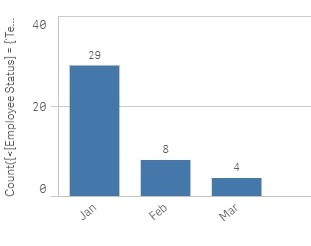
Separately it works fine. Please suggest me to manage it in one bar chart.
Shahzad_Ahsan
- Mark as New
- Bookmark
- Subscribe
- Mute
- Subscribe to RSS Feed
- Permalink
- Report Inappropriate Content
Hi Sunny
Please find the attached sample data.
sunny_talwar
- Mark as New
- Bookmark
- Subscribe
- Mute
- Subscribe to RSS Feed
- Permalink
- Report Inappropriate Content
What is your chart dimension here??? From what I am seeing you might need to create a Canonical Date here to resolve this problem of yours
Shahzad_Ahsan
- Mark as New
- Bookmark
- Subscribe
- Mute
- Subscribe to RSS Feed
- Permalink
- Report Inappropriate Content
Hi Sunny
Thanks for your reply
I read about Cannonical Date and tried to work. But not got the exact result.
I am sharing qvf file and data. Please have a look.
What I need is, I want month wise data for the current year.
