Unlock a world of possibilities! Login now and discover the exclusive benefits awaiting you.

- Qlik Community
- :
- Forums
- :
- Analytics & AI
- :
- Products & Topics
- :
- Visualization and Usability
- :
- Mix a Pivot Table behavior with a regular Table
- Subscribe to RSS Feed
- Mark Topic as New
- Mark Topic as Read
- Float this Topic for Current User
- Bookmark
- Subscribe
- Mute
- Printer Friendly Page

 Alcarz
- Mark as New
- Bookmark
- Subscribe
- Mute
- Subscribe to RSS Feed
- Permalink
- Report Inappropriate Content
Mix a Pivot Table behavior with a regular Table
Hi community,
I'm struggling to get the visual result that the end client wants.
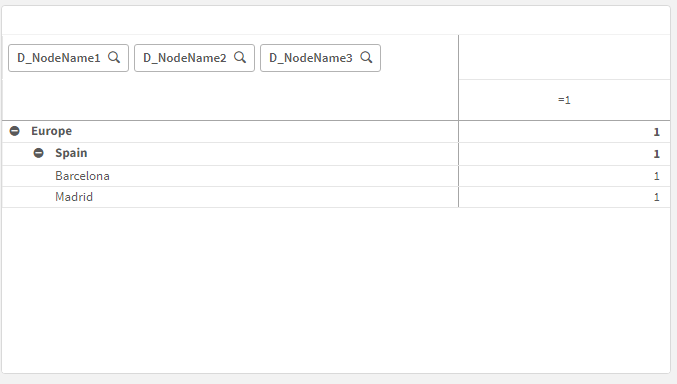
On one hand, they want the expand/collapse behavior from the Pivot Table. Here's an example (no measures, just the hierarchical rows behavior):
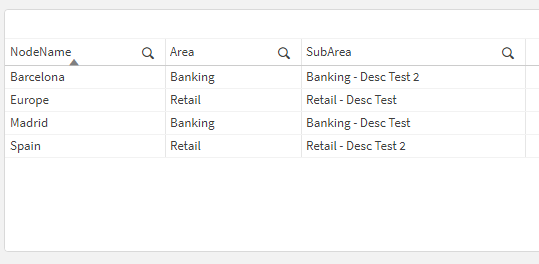
On the other hand, they want to show information for every row like we do in a regular table, like this:
So at the end, what they want it's a mix, something like this (manipulated):
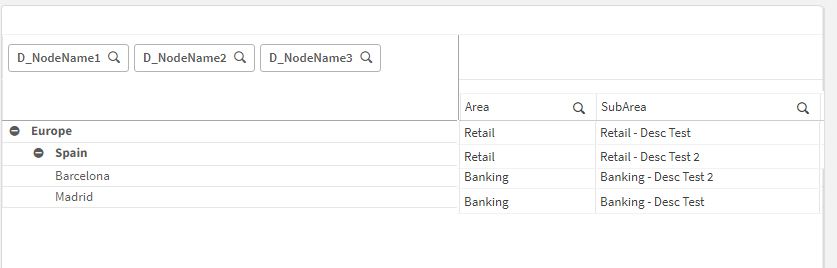
But since we can only show aggregate information in a pivot table, this is something unfeasible, right? I have been searching for extensions and workarounds and I haven't found anything to get something similar to that, so any help or idea is really welcome 🙂

 steeefan
- Mark as New
- Bookmark
- Subscribe
- Mute
- Subscribe to RSS Feed
- Permalink
- Report Inappropriate Content
Try using aggregation functions such as Only(Area) or Concat(SubArea) as your expressions.

 vinieme12
- Mark as New
- Bookmark
- Subscribe
- Mute
- Subscribe to RSS Feed
- Permalink
- Report Inappropriate Content
you can just use a straight table and somewhat recreate what you need by adding some indentation
If a post helps to resolve your issue, please accept it as a Solution.
Alcarz
- Mark as New
- Bookmark
- Subscribe
- Mute
- Subscribe to RSS Feed
- Permalink
- Report Inappropriate Content
Unfortunately that doesn't work. Check this screenshot:
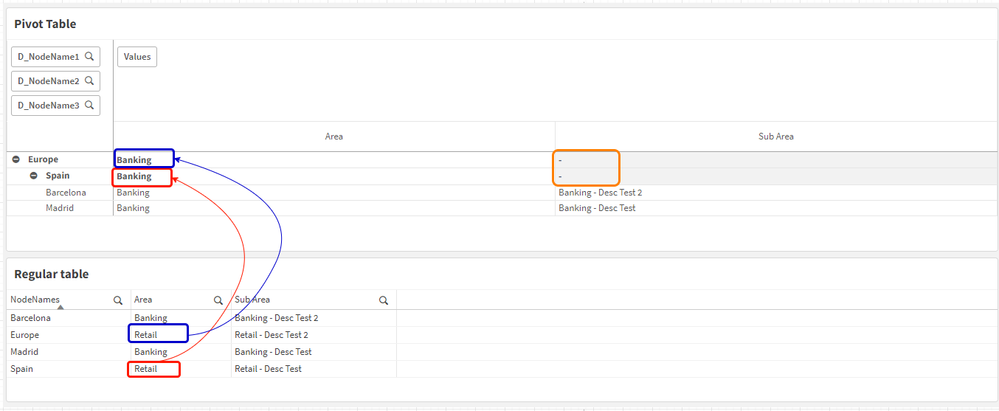
The problem with pivot table as you can see is that, when a node (like Spain) include one or more children (like Barcelona and Madrid), then for a given dimension (Area) its value will be its children's value (Banking)* instead of the corresponding value for Spain (Retail, in red). Same happens with Europe, getting Spain's value (in blue).
*In case the children have different values (like Sub Area, in orange) then they are empty.
I attach the app in case anyone needs it.
